This article shows you the back tests results of an EBIT to enterprise value (also called Earnings Yield) investment strategy.
Earnings before Interest and Taxes (EBIT) to Enterprise Value (EV) is truly the 80/20 valuation ratio when it comes to investing. You can compare it to any other single valuation ratio, over most time periods, and it will nearly always give you the best returns.
In this article you can see why it’s a great investment strategy as well as how, step by step, to implement it in your portfolio.
EBIT to Enterprise Value = Earnings Yield
In the Quant Investing stock screener we call EBIT to Enterprise Value Earnings Yield and I will use the both terms in this article - just so you know Earnings Yield = EBIT to Enterprise Value.
Returns of EBIT to EV
Here are the back tested returns you could have earned if you used and EBIT to Enterprise Value strategy to invest in Europe over the 12 year period 13 June 1999 to 13 June 2011.
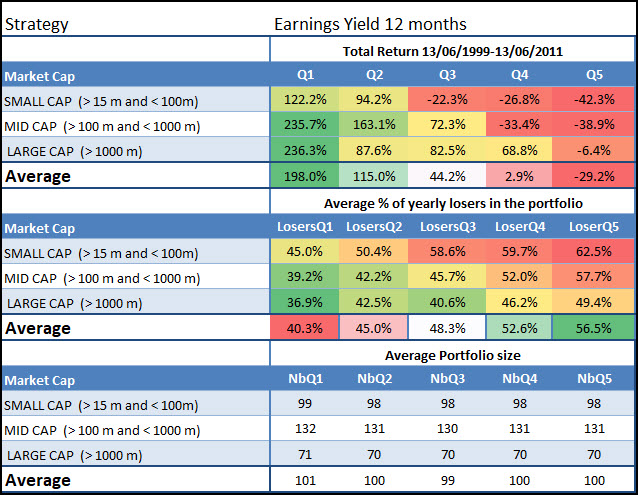
Source: Quantitative Value Investing in Europe: What works for achieving alpha
Q1 (Quintile 1) represents the cheapest 20% (most undervalued) of companies in terms of EBIT to Enterprise Value and Q5 (quintile 5) the most expensive.
Best for medium to large companies
As you can see the strategy worked best for medium and large companies. Before I show you how you can improve this investment strategy first some information on how we tested.
Substantial market outperformance
Just in case you were wondering – undervalued EBIT to Enterprise Value comfortably beat the market - over the 12-year period of the study, the market portfolio generated a return of only 30.54 % or 2.25% pa, dividends included.
To start using the EBIT to EV Investment Strategy in your portfolio - Click here
Methodology
We only use historical accounting data and no forecasts.
The reason for this is that there is ample evidence that forecasts cannot be relied on. For example, in his excellent book, ‘The New Contrarian Investment Strategy’, David Dreman mentioned a study that used a sample of 67,375 analysts' quarterly estimates for companies listed on US stock exchanges.
The study found that the average analysts’ error was 40%, and that the estimates were misleading two-third of the time!
So forecasted numbers are just about useless!
The backtest universe and benchmark
Our backtest universe is a subset of companies in the Datastream database containing an average of about 1500 companies in the 17 country Eurozone market during our 12-year test period (13 June 1999 to 13 June 2011).
We excluded banks, insurance companies, investment funds, certain holdings companies, and REITS. We included bankrupt companies to avoid any survivor bias. Bankrupt companies, or companies that were taken over, returns were calculated using the last stock market price available before the company was delisted.
We excluded companies with an average 30-day trading volume of less than €10 000.
Not a good time to invest in stocks
The test period was most certainly not a good time to be invested in stocks. The 12-year period we tested included a stock market bubble (1999), two recessions (2001, 2008-2009) and two bear markets (2001-2003, 2007-2009).
Holding periods and quintile tests
Each year all the portfolios we tested were formed on 16 June. We chose 16 June as most European companies have a December year-end and by this date all their previous year-end results would be available in the database.
The annual returns were calculated as the 12-month price change plus dividends received over the period. Returns were compounded on an annual basis.
This means each year the return of the portfolio (dividends included) would be reinvested (equally weighted) in the strategy the following year.
The portfolios were all constructed on an equal-weighted basis.
In order to test the effectiveness of a strategy, we divided our back test universe into five equal groups (quintiles), according to the factor we were testing. For example, when testing a low price-to-book (PB) value strategy, we ranked our back test universe from the cheapest (lowest PB) to the most expensive (highest PB) stocks.
The cheapest 20% of companies were put in the first quintile (Q1), the next in the second, and so on, with the 20 % of companies with the highest price-to-book value in the fifth quintile (Q5).
How you can improve the earnings yield investment strategy
You can improve your returns substantially if you combine EBIT to Enterprise Value with another ratio or indicator as the table below clearly shows:
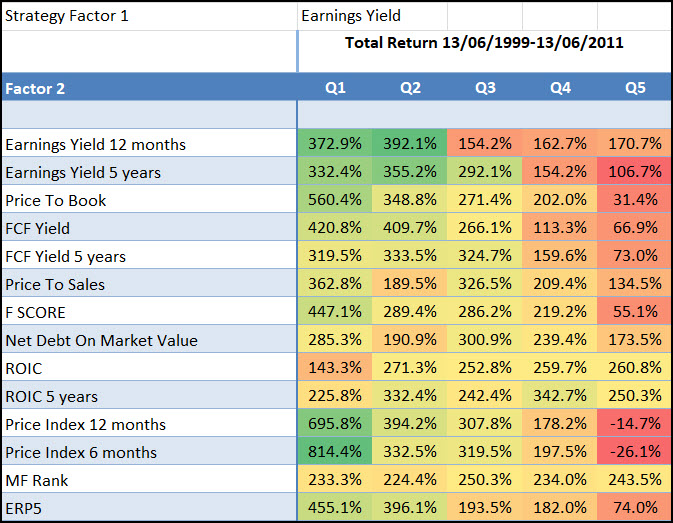
Best combination – Momentum
The best way to increase your returns was to combine EBIT to Enterprise Value with Price Index 6 months (6 months momentum) or Price Index 12 months (12 months momentum).
To implement your EBIT to EV Investment Strategy - Click here
How to implement this strategy in your portfolio
This is how you can implement this strategy in your portfolio using the screener:
- As the first factor or filter select the 20% of companies with highest Earnings Yield (EBIT/Enterprise value)
- As a second factor select the 20% of companies with the highest Price Index 6m (six months price momentum)
- Select the countries where you would like to invest
- Set your minimum daily trading value of companies you would like to look for - $125,000 in the image below
- Select the minimum market value of companies you would like to look for - $65m in the image below
- Click on the Apply button to run your screen
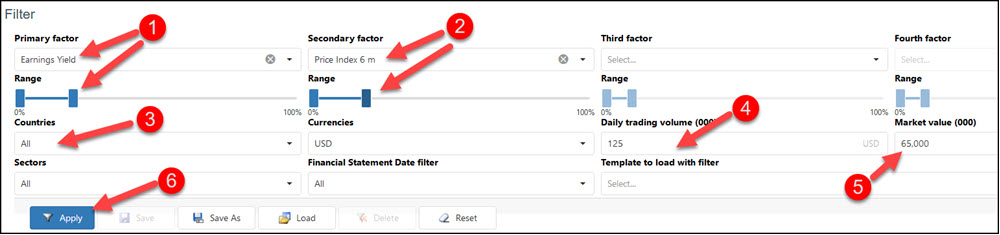
Click image to enlarge
In the results table click on the Earnings Yield column heading twice to sort the companies by earnings yield from high to low (the higher the Earnings Yield the more undervalued the company is).
You now have a list of companies that fits this investment strategy.
Limit your losses
We strongly recommend that you use a strategy to keep your losses low. You can read more about that here: Truths about stop-losses that nobody wants to believe
Exact definition – in glossary
You can see the exact definition of all the ratios and indicators in the Glossary
Further reading
You can of course combine EBIT to Enterprise Value with other valuation ratios and indicators.
Here is a list of other article you will find helpful:
This outperforms all other valuation ratios (14 year back test result)
This article tells you about Qi Value – which ranks the screener’s whole universe of companies (around 22,000) using the four valuation ratios we have tested with the best results. One of the four ratios is EBIT to Enterprise Value.
A simple ratio beats the world’s best value funds
This article shows you how a simple quantitative value strategy (using just one simple ratio EBIT to Enterprise Value) outperformed the world’s best value investment funds.
Is there something like a long term quant value investing strategy?
This article shows you exactly how and why you can implement a simple quant strategy that does not rely on short term rebalancing – in fact the holding period is three to five years.
Quality, value, momentum – the best strategy you have never heard of
This article shows you exactly how to implement the Quality Value Momentum (QVM) investment strategy which contains the best ideas from our research paper Quantitative Value Investing in Europe: What works for achieving alpha as well as all the research we have done since then.
The strategy makes use of EBIT to Enterprise Value and returned an astounding +1142% over 13 years!
Does systematic value investing really work? – Data driven back test
In December 2010 two friends finished an interesting research paper they called Systematic Value Investing: Does it really work? With this paper they wanted to find:
-
- The best investment strategy in Europe over the 11-years from June 1999 to June 2010
- If small portfolios perform better than large portfolios
- If 30 stock portfolios do better than 50 stock portfolios
What they found was really interesting and I asked them if I can write it up to share with you here.
Use this simple quality ratio to improve your investment returns
This article shows you a simple ratio you could use to increase your returns, irrespective of what investment strategy you follow - also your returns of an EBIT to Enterprise Value investment strategy.
PS To get an EBIT to Enterprise Value investment strategy working in your portfolio today simply sign up right here.
PPS It’s so easy to put things off, why not sign up right now.
To implement your EBIT to EV Investment Strategy - Click here