After the shake out so far this year here are a few deep value investment ideas of companies have plunged over 50% over 12 months.
What the screen looks like
This is what I screened for:
- All companies in our 22,000 company universe
- Market value over $100m
- Daily Traded Value over $100,000
- Financial statements updated in the last 9 months
- With a one year stock price decline of more than 50% (to do this I used Price index 12m = Current stock price / stock price 12 months ago)
- Sorted with companies with the biggest decline at the top
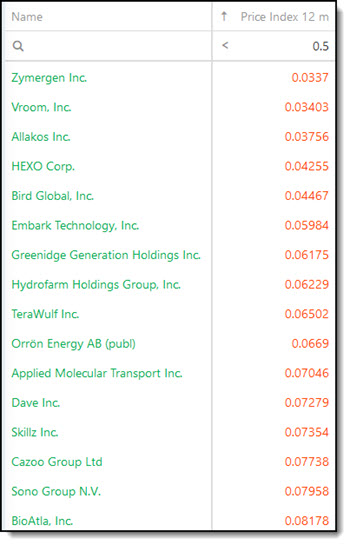
These were companies with the biggest price fall:

Click image to enlarge
As you can see some very wild stock price falls of over 95%!
Adding good fundamental momentum
I am sure you agree we have to clean this list up.
For example, what happens if we take the same list and only look for companies with good fundamental momentum?
To do this I used the same screen as above but screened out companies with a Piotroski F-Score of below 6.
The Piotroski F-Score is a great, easy to use, indicator you can use to substantially increase your returns.
You can read more about it here:
Can the Piotroski F-Score also improve your investment strategy?
This academic can help you make better investment decisions – Piotroski F-Score
Use the Piotroski F-Score to seriously improve your returns
How to increase your returns on average 210.6% (max 363.0%) – Piotroski F-Score
Ever thought of using a fundamental stop-loss?
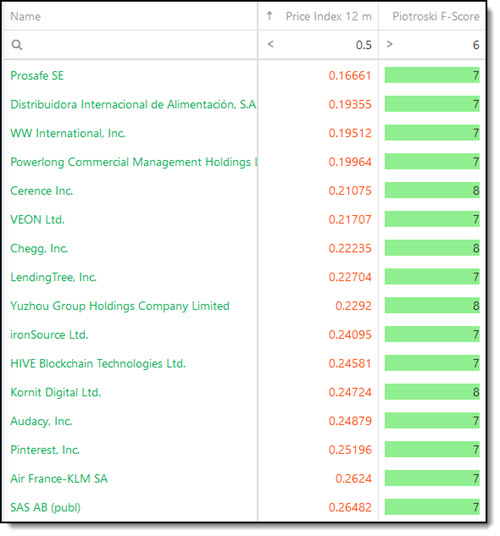
This is what the list of companies now looks like:

Click image to enlarge
Click here to start finding your own Deep Value ideas NOW!
Less extreme price falls but still high, some over 85%.
Only look for cheap companies
So far the list of companies tell you nothing about how undervalued the companies are.
To find undervalued companies I used the same screening criteria mentioned criteria and sorted the list of companies using our own developed composite rating called Qi Value - it is the ratio I use to find ideas for my portfolio.
You can read more about Qi Value here:
This investment strategy is working even better than we expected +711%
This outperforms all other valuation ratios (14 year back test result)
Qi Value Investment Strategy back test
What the screen looks like:
- All companies in our 22,000 company universe
- Market value over $100m
- Daily Traded Value over $100,000
- Financial statements updated in the last 9 months
- With a one year stock price decline of more than 50% (to do this I used Price index 12m = Current stock price / stock price 12 months ago)
- Piotroski F-Score higher than 6
- Sorted by Qi Value
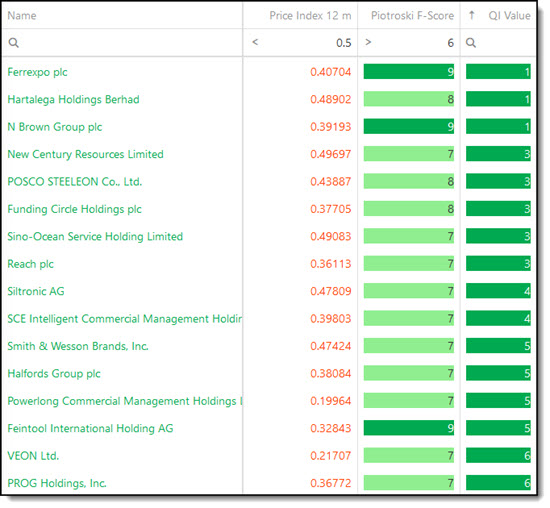
This is what the list of companies look like now:

Click image to enlarge
As you can see the bone jarring price drops got a little bit less but some still just under 60%.
Only look for high FCF Yield companies
FCF Yield is a great valuation ratio as it uses cash generated to value a company and cash cannot easily be manipulated by management.
FCF (Free cash flow) Yield is defined as Free Cash Flow divided by Enterprise Value, where Free Cash Flow equals cash from operations minus capital expenditure.
Now the screen looks as follows:
- All companies in our 22,000 company universe
- Market value over $100m
- Daily Traded Value over $100,000
- Financial statements updated in the last 9 months
- With a one year stock price decline of more than 50% (to do this I used Price index 12m = Current stock price / stock price 12 months ago)
- Piotroski F-Score higher than 6
- Sorted by FCF Yield
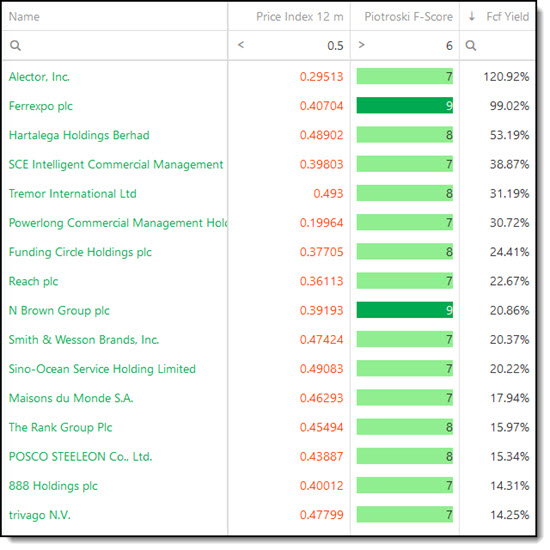
Here is the list of companies:

Click image to enlarge
Please do your own research
As with all screens this is just a list of companies that because of the large price fall may have VERY BIG problems.
Therefore do your own research and fact checking.
PS To get this strategy working in your portfolio right now click here
PPS Why not sign up right now before it slips your mind?


