Free cash flow (FCF) yield is a powerful tool to help you find stocks that are selling for less than they're worth. It is a great way to find hidden bargains in the stock market.
When you use FCF yield, you're looking at how much cash a company generates relative to its total value, which includes its debt and cash reserves. This tells you a lot about whether a stock is a good deal compared to other companies.
This article takes you through why FCF yield is a reliable metric and how you can use it to make smarter investment choices, especially when the market seems uncertain.
Understanding Free Cash Flow and Free Cash Flow Yield
Free cash flow (FCF) is the amount of cash a company has left after operating expenses, working capital movements and capital expenditures have been deducted.
It is the cash is available to pay back debt, buy back shares, and pay dividends.
FCF yield is calculated by dividing this free cash flow by the company's enterprise value (EV). Enterprise value is more comprehensive than just market capitalization; it includes the market cap plus total debt, minority interest, and preferred shares, minus excess cash.
In other words, it looks at the whole capital structure of the company and shows how much cash flow you are getting for each dollar invested in the company. A higher FCF yield often suggests that a company is undervalued.
Why Look at Free Cash Flow Yield?
FCF yield is a “clean” valuation metric, which means it’s less likely to be distorted by accounting practices and more reflective of a company's true profitability. It strips down a company’s value to its core cash-generating ability, which is harder to manipulate compared to earnings figures that can be adjusted by various accounting methods.
This makes FCF yield a favourite tool among value investors who want a straightforward look at a company's financials.
Studies have shown that stocks with high FCF yields tend to outperform because they are often undervalued.
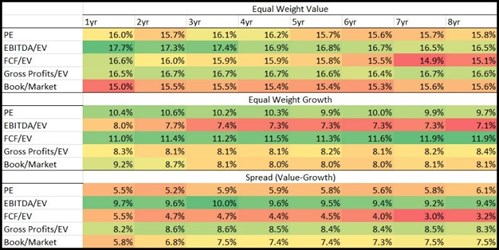
The article "Analyzing Valuation Measures: A Performance Horse-Race over the past 40 Years" by Wes Gray and Jack Vogel provides extensive data supporting the effectiveness of FCF yield as an investment strategy.
They found that over 40 years, stocks with higher FCF yields provided a LOT better returns than those with lower yields and other investment strategies. This proves the reliability of FCF Yield in identifying promising investment opportunities.
Here is a summary chart (Look at the FCF/EV row the 1yr column):

Source: Analyzing Valuation Measures: A Performance Horse-Race over the past 40 Years
Click here to start finding your own high FCF Yield ideas NOW!
More Evidence of Free Cash Flow Yield's Effectiveness
The research from Alpha Architect has demonstrated that free cash flow yield is an effective measure for assessing stock value across various markets. In the U.S., stocks that show a high FCF yield consistently deliver better long-term growth compared to those with lower yields.
This pattern holds true in other major markets as well, including Europe, where extensive studies have documented similar results over multiple decades.
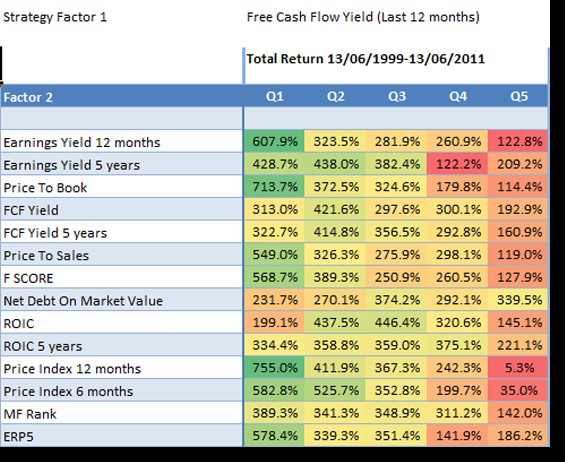
For example, the book "Quantitative Value Investing in Europe: What Works for Achieving Alpha" highlighted how stocks with higher FCF yields in Europe from 1999 to 2011 significantly outperformed the market return of 30.5% over the same period.

Source: Quantitative Value Investing in Europe: What Works for Achieving Alpha
This isn't just a one-off finding; it's a consistent pattern seen across different countries and market conditions, making FCF yield a universally applicable and powerful tool for investors worldwide.
Step-by-Step Guide to Using Free Cash Flow Yield
To start using FCF yield in your investment strategy, begin by identifying a company's free cash flow, which you can find on its cash flow statement. This figure is calculated by subtracting capital expenditures from the total cash generated from operations.
Next, calculate the enterprise value (EV) of the company, which combines the market cap (total market value of the company's outstanding shares) with its debt, minority interest, and preferred shares, and subtracts any excess cash.
Then divide the FCF by the EV to get the FCF yield.
Use financial websites or a stock screener like the Quant Investing stock screener to help automate these calculations and find companies with the highest FCF yield.
Click here to start finding your own high FCF Yield ideas NOW!
Using Historical Data for Comparative Analysis
Using historical data to compare current FCF yields can also tell you a lot about a company's valuation over time. For example, if a company's current FCF yield is significantly higher than its historical average, it might suggest that the stock is undervalued. Conversely, if the yield is much lower than the average, the stock might be overpriced.
Historical comparisons can also help you understand the impact of market cycles on FCF yields and identify patterns that could inform your investment timing. This kind of analysis requires access to historical financial data, which many financial information sites and stock screeners can provide.
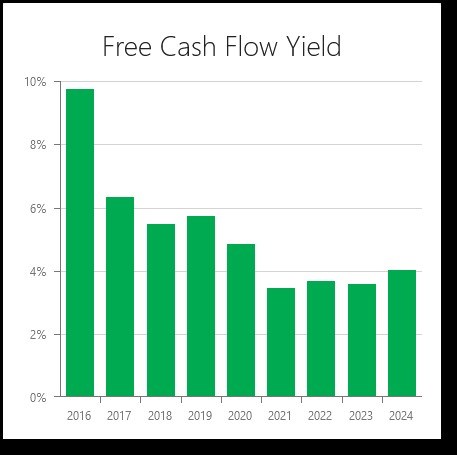
For example, with the Quant investing stock screener, you can easily see a company’s FCF Yield over the past eight years.
Here is an example of Apple Inc:

Source: Quant Investing stock screener
Enhancing Free Cash Flow Yield Strategy with Other Ratios
While FCF yield is a powerful tool on its own, combining it with other financial ratios can give you even deeper insights. For example, adding a debt-to-equity ratio can help you avoid companies that are generating high free cash flow but are heavily indebted.
Similarly, integrating return on invested capital (ROIC) can help you find companies that are not only undervalued but also don’t need a lot of capital.
Studies have shown that combining FCF yield with momentum indicators, such as the 12-month price index, can significantly boost investment returns. This approach can refine your investment strategy, helping you choose stocks that are both undervalued and have strong upward price momentum.

Source: Quantitative Value Investing in Europe: What works for achieving alpha
Look at column Q1
Look at the returns in column Q1, it shows the returns generated by first selecting the 20% best free cash flow yield companies combined with the ratios in the column called Factor 2.
The best combination +755% was Momentum (506.3% improvement)
As you can see the best way to increase your return (+755.0%) was to combine free cash flow yield with Price Index 12 months (12 months momentum).
The price index 12 months is calculated as the current share price/share price 12 months ago.
This means if you invested only in the 20% of high free cash flow yield companies that also had the top 20% 12 months price index you could have increased your return by 506.3% (755.0% - 248.7%) compared to if you only invested in companies with the highest free cash flow yield.
That is an improvement of over 2 times the original return!
Summary and Conclusion
Free cash flow yield is a straightforward, reliable metric that can help you identify undervalued stocks capable of delivering high returns. By understanding and applying this measure, you can enhance your ability to make informed investment decisions, especially in turbulent market conditions.
Remember, the key to successful investing is not just about picking winners but also about using proven, robust metrics that can guide your decisions. Free cash flow yield offers just that — a clear view into the real value of stocks, helping you build a stronger, more resilient portfolio.
Why not start using FCF Yield Now
Why not start exploring free cash flow yields in your investment portfolio today? With the right tools and a bit of practice, you'll soon be able to spot the best investment opportunities the market has to offer.
Consider subscribing to an easy-to-use stock screener, like the Quant Investing stock screener to help you find the highest FCF Yield stocks.
Click here to start finding your own high FCF Yield ideas NOW!


