
This is the editorial of our monthly Quant Value Investment Newsletter published on 06.08.2024. Sign up here to get it in your inbox the first Tuesday of every month.
This month you can read about ramp and dump scams and about the newsletter’s yearly return.
But first the portfolio updates.
Portfolio Changes
Europe – Buy One – Sell One
One new recommendation this month as the UK FTSE 100 index is above its 200-day simple moving average.
It is a very fast growing (+42% last year) GBP 241m, UK-based manufacturer, distributor, and brand owner of fast-moving consumer products. It is also dirt cheap, trading at a Price to Earnings ratio of 10.4, Price to Free Cash Flow of 10.8, EV to EBIT of 7.4, EV to Free Cash Flow of 10.9, Price to Book of 4.0 and it pays a dividend of 2.4%.
Sell One
Sell Asseco Poland S.A. at a profit of +7.2% as it no longer meets the portfolio’s selection criteria.
North America – Nothing to do
No new recommendations this month as the companies we found elsewhere in the world fit the newsletter’s investment strategy a lot better.
Asia – Buy One – Sell Six
One recommendation this month as the Singapore index is above its 200-day simple moving average.
We had to remove three great Japanese ideas as the index crashed through its 200-day simple moving average.
The one recommendation is an SGD 505.1m (€348.5m) Singapore-based infrastructure engineering services and geo-spatial technology company trading at Price to Earnings ratio of 7.5, Price to Free Cash Flow of 5.3, EV to EBIT of 1.6, EV to Free Cash Flow of 1.6, Price to Book of 1.0 with a 4.0% dividend yield.
Sell Three
- Sell Ebara Foods Industry, Inc. at a loss of -5.5%.
- Sell Mitsubishi Shokuhin Co., Ltd. at a profit of +33.7% and
- Sell Press Kogyo Co., Ltd. at a loss of -4.0%
as the companies no longer meet the portfolio’s selection criteria.
Stop Loss
- Sell Kaga Electronics Co., Ltd. at a loss of -18.4%
- Sell Fuji Furukawa Engineering & Construction Co. Ltd. at a profit of +25.5%
- Sell JFE Systems, Inc. at a loss of -24.6%
Crash Portfolio – Nothing to do
No new Crash Portfolio ideas as most markets have recovered.
To date, the 15 Crash Portfolio ideas, recommended between August 2022 and May 2023, are up an average of 35.4%!
Yesterday’s Volatility
Like you, yesterday’s extreme price movements caught me by surprise.
What caused this? No one knows but it looks like just talking about a U.S. recession rocked global stocks and bond yields. Doubts about AI and Japan's volatility have added to the chaos. Investors rushed to buy "safe" bonds, waiting for interest rate cuts.
Warren Buffett's Berkshire Hathaway lost faith in stocks, raising cash to nearly $277 billion and selling half its Apple shares. Perhaps this caused Apple and Nvidia to fall nearly 10% before Monday.
Japan, one of Buffett's favourite markets, and ours as well reacted strongly. The Nikkei Index dropped over 12% — the worst since 1987 — due to a yen surge after government intervention and rate hikes. This rise affects global markets, disrupting "carry trades", borrowing the Yen at low interest rates, and investing elsewhere.
The panic spread on Monday, with South Korea and Taiwan down 8% and Europe falling over 2%.
What to Do Now
Markets are still volatile as you saw with the big bounce back in Japan today. Where does this leave us with the triggered stop trailing stop losses you may be thinking?
We left the portfolio prices updated as of Friday as we did not want to update the prices as of yesterday because then a lot of the stop losses would be triggered. And as you can see that would not have been a good decision as the market bounced back today.
This is also the reason why I say you should never leave trading stop loss orders with your broker.
In the newsletter we will continue to follow the system that has worked great over the past 14 years. In the next newsletter we will look at the trailing stop losses and act accordingly. We will not be selling anything during the month.
If you are nervous and worried about your portfolio, I suggest the following. Wait for the volatility to settle before taking another look at your portfolio and the trading stop losses. Then selectively sell a few positions until you feel comfortable.
Remember your investment portfolio should not keep you up at night. So, make sure that you sell down to the point where you feel comfortable. There is no right answer here just what works for you.
Hong Kong Scams and Yearly Return Questions
Here are the answers to two great customer questions.
Hong Kong Order Gives Me a Scam Warning
Question:
“When I go to order the Hong Kong stocks in Interactive Brokers, I am getting a message warning me about Ramp and Dump scams.
Can you advise me as to what to do?”
Answer:
It is great that your broker has a warning as those scams do come up in Hong Kong from time to time.
A Ramp and Dump scam involves artificially inflating the price of a stock (ramping) through false or misleading positive statements, followed by selling off the stock at the high price (dumping), leaving other investors with losses when the price falls back to its true value.
It is also something we carefully look at when researching companies in Hong Kong. We look at the most recent news, look to see if the stock price has made wild movements or large traded volume changes recently.
We also look at David Webb’s website (webb-site.com) where he has a large database of companies involved in questionable activities.
I have been investing in Hong Kong stocks for over 15 years and have not been a victim of one of these scams.
It is of course always possible that something unexpected can go wrong that is why we keep position sizes small.
That said the regulator in Hong Kong does go after stock manipulators as this example shows: 3 Jailed Between 52 And 80 Months in Landmark Market Manipulation Case.
The Yearly Returns Compared to Averages Makes No Sense
Question:
“In your latest newsletter, you summarized your performance to date, which is valuable information. However, the yearly return table raises several questions.
- How exactly did you calculate these yearly returns?
- Is the table reflecting the newsletter's return?
- Additionally, how did you manage to construct a portfolio from the newsletter?
- What assumptions did you make?
It doesn't seem feasible to be 100% invested all the time based on following the newsletter.
How can you calculate the return of a portfolio if it is not fully invested? Or did you mean something else with this table?
There appears to be a significant gap between the average return per idea (22.4%) and the average yearly return (about 9.8%). Almost no year reaches the average return of the ideas, with nearly all years falling below this average.
Where do you think this discrepancy arises from?
Could you clarify these points and shed some light on the calculations and assumptions underlying your yearly return table?”
Answer:
These are good questions and show I should have explained the table better.
The subscriber is referring to these two tables:
Average Return of All Ideas
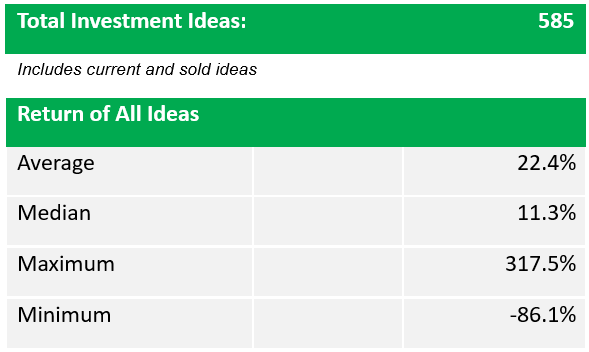
- Loss of 86.1% occurred before we started the Stop Loss system
- Returns are calculated as price change plus dividends in the currency of the company's main listing.
- Includes returns of Crash portfolios
Yearly Returns

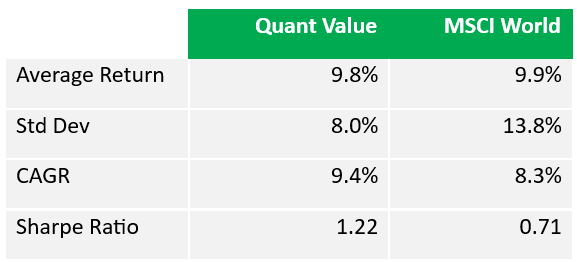
Performance of the newsletter compared to the MSCI World stock market index
Std Dev = Standard Deviation of all yearly returns
CAGR = Compound Annual Growth Rate
Sharpe Ratio = Average Return / Std Dev (Risk adjusted return measure)
The difference he is referring to is the 22.4% average return of all ideas and the 9.8% average yearly return.
The Yearly Returns Chart
The Yearly Returns chart shows the average return of all the companies in the portfolio in that year.
In other words, it is the average return (price change and dividends received) of all the companies that were in the portfolio:
- At the start of the year,
- Added to the portfolio and
- Sold in that year.
The Average Return of All Ideas
To calculate the values in this table we calculate the price change plus dividends in the currency of the company's main listing, and then average this number over all the ideas recommended.
Comparing The Yearly with Average Returns
It's very hard to compare yearly returns with average returns.
Here are the reasons why.
Average Return per Idea: This is a straightforward calculation that takes the return of each investment idea, sums them up, and divides by the number of ideas. It gives a simple arithmetic mean of the returns.
Yearly Portfolio Return: This involves adding the returns of all companies in the portfolio for a given year, including those that were added or sold during that year. This calculation adds more variables, such as the timing of when ideas are added or exited and the varying impact of each idea on the portfolio.
For example, if an idea is added in the middle of the year, its return contribution is only for the portion of the year it was held. This can significantly dilute the annual return.
Also, some ideas are held for more than a year, even if this represents only a small percentage of all ideas.
For example, Reply SPA increased +269.2% from November 2022 to November 2014. The average return was 269% but the annual return was yearly return was 90.3% This can cause discrepancies when comparing yearly returns to the average return per idea.
Role of Diversification
Individual ideas might have high returns, but the portfolio’s performance is influenced by diversification. Not all ideas perform equally, and the presence of lower-performing ideas or losses can bring down the overall average.
High-performing ideas might not have a proportional impact if they represent a smaller portion of the portfolio or are held for shorter periods.
Depending on when a company performs well or not influences the yearly return but not the simple average.
I hope this explanation helps. If anything is still unclear, please let me know. (Click the Need Help button)
Do These Ideas Sound Interesting?
If these ideas sound interesting, you can get more information here: Your Treasure Map to Europe, Asia, and North America's Hidden Gems!
Want to have a look before you subscribe? Simply click the Need Help button ans send us a message with “Quant Value trial issue” in the form and we will send you a recent issue to review.