
Are you are looking for a way to screen out companies that are manipulating their results? This article can help you.
Is a company manipulating its results
We here at Quant Investing are always looking for and testing the results of good academic studies to give you more and better tools to use in the Quant Investing stock screener. We recently found an interesting research paper that can help you find out if a company is manipulating its financial statements.
What is the Beneish M-Score?
You can do this by using an indicator called the Beneish M-Score (M-Score) which is already built into the screener.
The M-Score comes from a research paper published in 1999 by Dr Messod Beneish; an accounting professor at Indiana University's Kelley School of Business (where I finished my MBA) called “The Detection of Earnings Manipulation.”
In the paper Dr Beneish built a model he called “probability of manipulation,” or “PROBM” (M-Score) based on forensic accounting principles.
(To see just how easy you can use the M-Score in your screens scroll to the bottom of the article)
Easy to understand
And even though the statistics the model uses is sophisticated the outcome is easy to understand because the model creates a value (M-Score) which you can use to see if there is a high probability that a company is manipulating its financial statements.
How is the Beneish M-Score calculated?
The PROBM model (or M-Score) is made up of the following components:
DSRI = days' sales in receivables index.
Measured as the ratio of days' sales in receivables in year t to year t − 1. Large increases could indicate attempts by management to inflate revenues
GMI = gross margin index.
Measured as the ratio of gross margin in year t − 1 to gross margin in year t. Gross margin has deteriorated when this index is above 1. All else being equal, a firm with poor prospects is more likely to engage in manipulation.
AQI = asset quality index.
Asset quality is measured as the ratio of non-current assets other than plant, property and equipment to total assets. AQI measures the proportion of total assets where future benefits are more opaque and the assets are considered intangible. The measure may indicate attempts at cost deferrals in the form of intangible assets on the balance sheet.
SGI = sales growth index.
Ratio of sales in year t to sales in year t − 1. Sales growth does not indicate manipulation; however, high sales growth does create certain expectations for management—many of which are unsustainable. Managers who face decelerating fundamentals and who currently manage high-expected-growth firms have high incentive to manipulate earnings.
DEPI = depreciation index.
Measured as the ratio of the rate of depreciation in year t – 1 to the corresponding rate in year t. DEPI greater than 1 indicates that assets are being depreciated at a slower rate. Managers may be adjusting depreciation methods to temporarily inflate earnings.
SGAI = sales, general and administrative expenses index.
The ratio of SGA expenses in year t relative to year t − 1. Firms with growing SGA may indicate managers who are capturing firm value via higher salaries.
LVGI = leverage index.
The ratio of total debt to total assets in year t relative to year t − 1. An LVGI greater than 1 indicates an increase in leverage, which may increase the probability that a firm will breach a debt covenant. All else being equal, the probability of manipulation is higher in the face of a potential covenant breach.
TATA = total accruals to total assets.
Total accruals calculated as the change in working capital accounts other than cash less depreciation. High accruals indicate a higher likelihood of earnings manipulation.
The eight variables from PROBM are then weighted together as follows:
PROBM = −4.84 + 0.92 × DSRI + 0.528 × GMI + 0.4.404 × AQI + 0.892 × SGI + 0.115 × DEPI −0.172 × SGAI + 4.679 × TATA − 0.327 × LVGI
We calculate everything for you
Don't worry if this looks intimidating. You don't have to calculate anything or even understand why we do it all for you.
Greater than -2.22 is bad, smaller than -2.22 is good
All you have to do is correctly interpret the M-Score as follows:
A M-Score greater than -2.22 indicates a strong likelihood of a firm being a manipulator.
So a M-Score of smaller than -2.22 (more negative) is good.
Click here to let the M-Score help you select better investment ideas
Does the M-Score work?
Well does it work you may be thinking?
It does as the M-Score ahead of time correctly identified 12 of the 17 highest profile US fraud cases in the period 1998 to 2002.
Not only that but companies that were identified as potential earning manipulators also generated lower stock market returns.
Manipulators generated lower returns
For example in the 14 year period from 1993 to 2007 companies that were identified as potential profit manipulators returned 9.7% less than companies that were not identified as earnings manipulators.
Identified Enron before Wall Street
Also students from Cornell University used the M-Score to correctly identify Enron as an earnings manipulator while experienced financial analysts on Wall Street were still recommending that you buy Enron shares.
Click here to let the M-Score help you select better investment ideas
How you can use it in the screener
As the Beneish M-Score (M-Score) is a binary indicator (either good or bad) the easiest way for you to use it is as a filter in one of the columns in your screen.
To do this click the Choose column icon

Under the Quality heading select M-Score (Beneish) 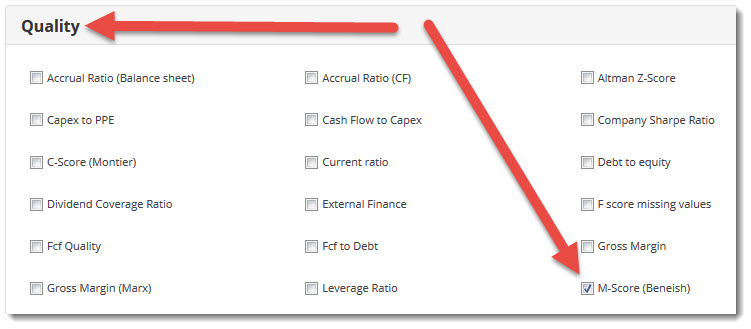
Then filter the values in the M-Score (Beneish) column by typing in -2.22 in the space below the heading, click the funnel image next to it, and select Less Than 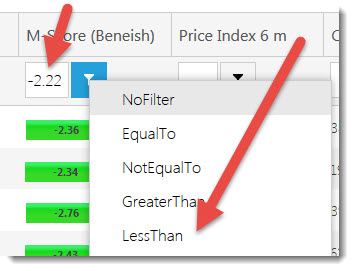
Excluded all the earnings manipulators
This will ensure the list of companies in your screen don’t have any companies with a bad Beneish M-Score.
PS To get the Beneish M-Score working in your portfolio right away sign up here.
PPS Why not sign up right now before you forget?
Click here to let the M-Score help you select better investment ideas