Since I wrote to you about how low liquidity companies can increase your investment returns in the article This overlooked ratio, large funds and hedge funds can’t use, gives you higher returns I have been looking forward to test this ratio in combination with the other best ratios and indicators from our latest research and best ideas from the research paper Quantitative Value Investing in Europe: What works for achieving alpha.
This is how we came up with the Neglected, Value and Momentum investment strategy.
A simple idea
Even though it seems complicated the basic idea is simple and easy to implement in your portfolio:
- First find companies with good share price momentum
- Then look for neglected companies with low traded volume compared to profits, ignored by most fund managers and broker research
- Then remove low quality businesses with low profit margins
- Choose the 20 most undervalued companies in terms of operating profits to enterprise value (Earnings Yield)
How are the companies selected?
Before we get to the details of the strategy the following table gives you a summary of how the strategy selects investment ideas:
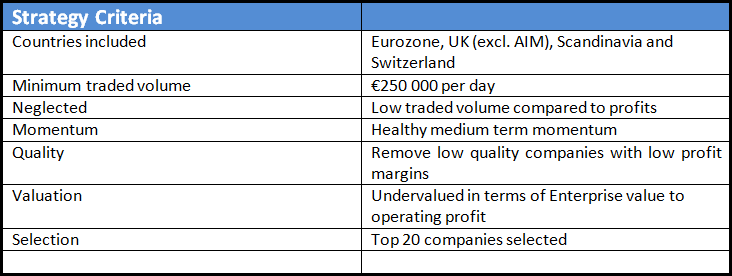
Click image to enlarge
Click here - To get Neglected, Value and Momentum investment ideas
Momentum
If there's one fact that came out of the above-mentioned research study it is that if you want high returns you have to consider share price momentum.
To select investment ideas for the Neglected, Value and Momentum (NVM) investment strategy we use medium term (6 month) share price momentum so that only companies with an upward moving share price are included.
This also helps you avoid value trap companies as they mostly have falling share prices.
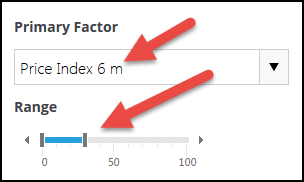
In the screener as a Primary Factor choose Price Index 6m from the drop down list under the heading Momentum and then with the slider select the top 30% of companies with the best 6 month Price index as shown below.
Neglected Companies
Next you want to select companies that are neglected by the market and thus are more likely to be undervalued.
You do this by only selecting companies where the yearly traded volume is low compared to profitability.
Because these companies have low traded volume they are not on the radar screen of fund managers with large amounts of money to invest as they can’t buy enough of the company to have any impact on the fund’s performance.
Also brokers (and their analysts) are not interested in these companies as they cannot make enough money trading the company’s shares to make it profitable for them to research the company.
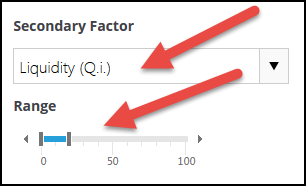
In the screener as a Secondary Factor choose Liquidity (Q.i.) from the drop down list under the Valuation heading. Select the most illiquid 20% of companies with the slider as you can see below.
Quality
The next step is to remove all the low quality businesses. You do this by removing or screening out companies with low profit margins compared to assets.
Even though this ratio may seem odd at first studies have found that it is one of the best ways to identify quality companies.
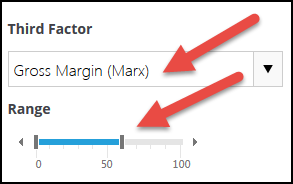
In the screener as a Third Factor choose Gross Margin (Marx) from the drop down list under the Quality heading. Use the slider to select the top 60% of companies with the highest Gross Margin (Marx) values.
Valuation
After doing all the above you then sort the companies that pass all the above criteria by Earnings Yield (earnings before interest and taxes (EBIT) to Enterprise value) which research studies have shown in the best valuation ratio you can use to identify undervalued companies as it also takes the capital structure (debt, equity and cash) of the company into consideration.
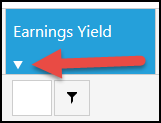
In the screener go to the column Earnings Yield and click on the column heading to sort the column from high to low.
To sort from high to low you must click the column heading twice because if the first time you do the column will be sorted from low to high which is not what you want (you want the small arrow to point down) as shown in the screenshot below.
Buy the top 20 companies
Once you have completed all the above steps the strategy invested in the 20 companies with the highest earnings yield.
Click here - To get Neglected, Value and Momentum investment ideas
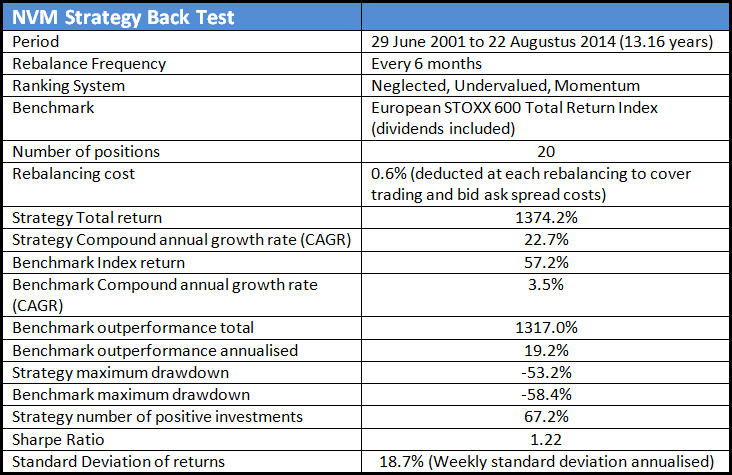
1374.2% over 13 years or 22.7% per year
The following table summarises the returns the strategy generated over a period of just over 13 years.
Click image to enlarge
13.2 times your initial investment
As you can see in just over 13 years the strategy returned nearly 1320% or 13.2 times your original investment, outperforming the market by nearly 20% per year.
Yearly performance
The following table shows the yearly performance of the strategy compared to the European STOXX 600 Total Return Index which includes dividends:

Click image to enlarge
(*) Inception date 29-06-2001
(**) End date 22-08-2014
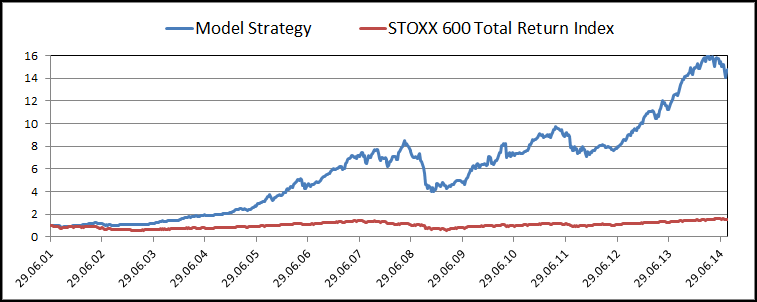
Growth of your investment in the strategy
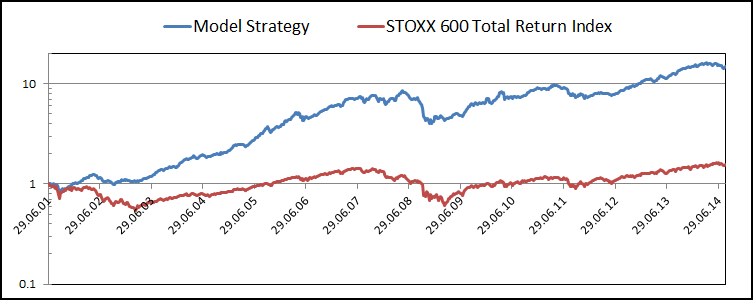
This chart shows the growth of investing €1 in the strategy compared to if you invested in the European STOXX 600 Total Return Index (dividends included).
Click image to enlarge
This chart also shows your return of investing €1 in the NUM Strategy and the index but it used a logarithmic scale to show that the index is even more volatile than the NVM Strategy.
Click image to enlarge
Summary
As you can see the Neglected, Value and Momentum investment strategy would have given you outstanding returns if you used it over the past 13 years.
But, like any equity investment strategy it is not without risk as you can see with the 52.3% maximum fall (draw down) in the value of the portfolio.
Even though this fall took place during the 2008 - 2009 financial crisis keeping your faith in the strategy, or just remaining invested in the stock market after such a large fall is very difficult.
But in the end you can see that your ability to stick to the strategy would have been very worthwhile.
PS To get this strategy working in your portfolio today sign up here
PPS Why not sign up right now before you forget?
Click here - To get Neglected, Value and Momentum investment ideas