Can you beat the market by only investing in small companies? This is a simple question I am sure you have also asked yourself but not something that can be answered as easy as I thought.
Past research not encouraging
Past research on small company returns found that:
- They were mainly generated in January
- They varied significantly over different time periods
- The outperformance declined substantially from the early 1980’s when the first research papers appeared saying that small companies outperform.
- The best performing companies were too small to buy (less than $5 million in market value)
- Small company outperformance could not be found internationally
- The best performance was concentrated in a few illiquid companies
If these results did not give you any reason to think that you can beat the market by buying small companies I would not blame you.
But the following research paper changed my thinking and I am sure will change yours too.
(Be sure to read to the end of the article where I show you exactly how to find the right companies)
All the above ideas are not true
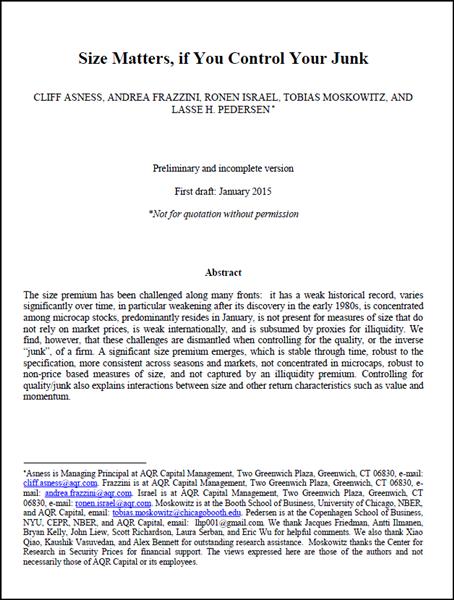
All the above ideas on investing in small companies were found not true by a very extensive 59 page January 2015 research paper called Size Matters, If You Control for Junk.
The paper was written by five researchers all linked to the respected fund management company AQR Capital Management.
First get rid of junk companies
The paper found that small companies generate a LOT higher returns than large companies and the market BUT (very important) you must only buy quality small companies.
Click here to start your quality small company portfolio now
They also found that:
- You do not have to invest in the smallest companies to get these returns,
- Small quality companies outperform the market and large companies over all time periods,
- Quality small companies also outperform the market and large companies internationally and
- You do not have to invest in small illiquid companies to get these higher returns.
What you have to look for
This all sounds very good I'm sure you also thinking.
But before we start buying let's find out exactly what the researchers tested and what they did to find quality small companies.
What they tested
Data used – 55 and 29 years
In the USA the researchers used over 55 years of data (July 1926 to December 2012).
Internationally the researchers tested their ideas in 23 countries using 29 years’ of data (January 1983 to December 2012).
How quality minus junk was tested
The researchers separated companies between junk and quality as described in the 2013 research paper Quality Minus Junk:
- Profitability - Calculated as profitability over book value,
- Growth – Calculated as profit growth over the past five-years,
- Safety - Defined as lower than market beta and volatility and fundamental-based measures of safety such as low leverage, low volatility of profitability, and low credit risk,
- Pay-out - Measured as the part of profits paid out to shareholders. A higher pay-out is more positive as long as it does not lower future profitability.
These portfolios were formed and tested
All the companies in the back test database were ranked by size (large and small companies) and quality (good quality, middle quality, junk quality).
They then formed six portfolios to track: Good quality, middle quality, junk quality large companies and good quality, middle quality, junk quality small companies.
To calculate performance they went long the two quality portfolios (large and small quality) and shorted the two junk portfolios (large and small company junk).
What they found
1. The Size effect is not large – until you look at quality and junk
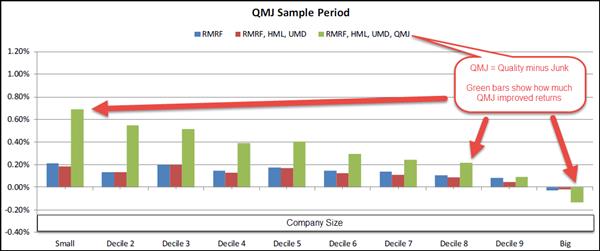
Just investing in small companies would not have helped you outperform the market as the return from small companies minus the return from investing in large companies on average performed about 0.12% per month better than the market which is not much different than zero.
But if you bought quality small companies and shorted junk small companies the researchers found it increased returns substantially.
If you use this strategy it would have increased your monthly market outperformance to 0.49% (just under 6% per year), a great improvement.

Click to enlarge
Source: Size Matters, If You Control for Junk.
This may not sound like much until you think that this was achieved over a 55 year period in the USA. This outperformance is HUGE!
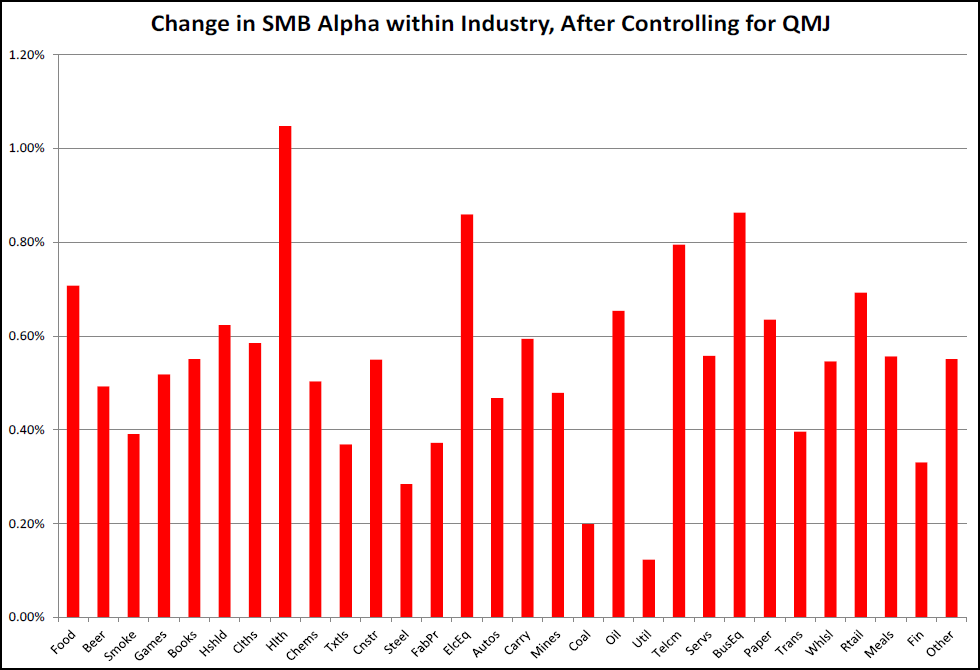
They also tested this across 30 different industries and quality small companies minus junk small companies did substantially better than a small minus big company strategy.
Click to enlarge
Source: Size Matters, If You Control for Junk.
Click here to start your quality small company portfolio now
2. Does the performance differ over time?
It is a well-known fact that small companies did not do well in the 19 year period from 1980 until 1999.
However when the researchers tested the small company quality and junk strategy (long and short) this proved not to be true.
The strategy improved the return of small companies to the same level in the 22 year period when small company investing did really well from July 1957 to December 1979.
3. Is the small company quality minus junk outperformance mainly due to extremely small companies?
The researchers found that this is true if you just look for cheap small companies.
But when they only looked at a strategy of buying quality minus junk companies they found that the performance increases steadily as you moved from large to small companies with no extreme movements by very small companies for example.
Click to enlarge
Source: Size Matters, If You Control for Junk.
4. What about size measures not linked to share price?
To move away from market value as the only definition of company size the researchers also looked at the performance of small companies as defined by:
- Total assets
- Equity
- Sales
- Property, plant and Equipment (PP&E)
- Number of employees
The results were the same as other factors the researchers looked at.
If they ignored quality, and looked only at the size factors above, there was no proof that small companies performed better than large companies.
But as soon as they only looked at quality small companies using all the above definitions of size, small companies did a lot better than large companies.
5. Does buying quality small companies world-wide work?
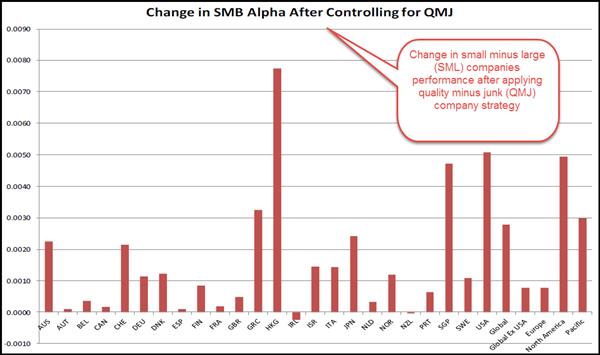
The researchers also tested their strategy of investing in quality small companies and shorting junk small companies across 24 countries.
The strategy beat investing in large companies in 23 of the 24 countries tested. Only in Ireland did it perform the same.
The researchers also tested the other measures of company size and found that in all cases that quality small companies outperformed large companies.
Click to enlarge
Source: Size Matters, If You Control for Junk.
Research conclusion
In the conclusion of all their research the researchers simply said:
Size matters, much more than they previously thought BUT you MUST only buy quality small companies.
They looked at all the previous ideas of why small companies outperform large companies such as:
- That the outperformance is weak overall,
- Has not worked in all time periods,
- Varies significantly through time,
- Only works because of a few extreme companies,
- Only works in January (January effect),
- Only works for market-price based measures of size,
- Is due to illiquidity, and
- Is weak internationally
The researchers looked at each of these concerns while sorting small companies into two camps:
- Buy good quality small companies
- Sell short bad quality (junk) small companies.
They found that:
- If you differentiate between quality and junk small companies a much stronger small company effect emerges that:
- Is strong across a number of definitions of company quality
- Is strong across time, including those periods where the size effect seems to fail;
- Is the same across company size and not concentrated in a few extreme companies;
- Is strong across all months of the year, not just January;
- Is strong across non-market price based measures of company size;
- Is not due to only illiquid companies and
- Works just as well internationally.
I am sure you agree that this is a very strong argument for you to invest a part of your portfolio in quality small companies worldwide.
Click here to start your quality small company portfolio now
Exactly how you can find quality small companies
With the Quant Investing stock screener it is very easy to find quality small companies.
The Piotroski F-Score
The easiest way for you to select quality companies is to use the Piotroski F-Score.
You can find out exactly what the Piotroski F-Score is and how it is calculated in the following article: This academic can help you make better investment decisions – Piotroski F-Score
We have tested it extensively with very good results which you can read about here:
Can the Piotroski F-Score also improve your investment strategy?
The gross margin ration (Novy-Marx)
Apart from the Piotroski F-Score the other best quality ratio we have tested is the gross margin ratio developed by Professor Robert Novy-Marx.
He defined a quality company as one that had a high gross income ratio (in the screener called Gross Margin (Marx) which he calculated by dividing gross profits by total assets.
You can read more about the gross income ratio here: Have you been using the wrong quality ratio?
Here is the screen you can use – saved for you already
This is the screen I have put together using all the above mentioned criteria specified in the research paper.
To make it as easy as possible to use I saved this screen for you as a standard screen you load and use with a few mouse clicks.
The saves screen is called Quality Small Companies and looks like this:
Quality small company screen
Click image to enlarge
How to load the screen
To load the screen click on My templates, then on Load a template, then on the Predefined templates where you must click on the screen called Quality Small Companies as shown below.
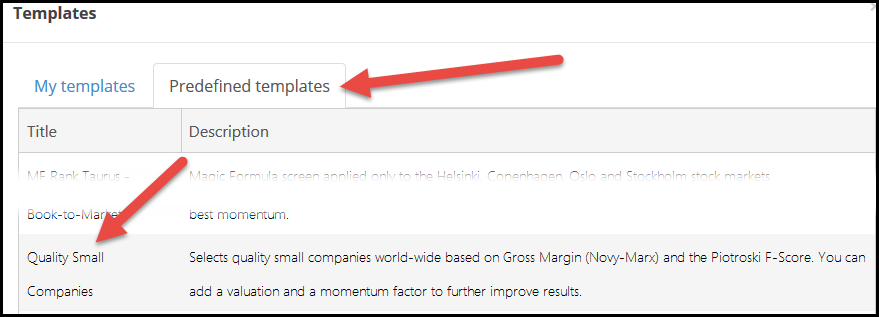
Saved screen you can use to find quality small companies
Click image to enlarge
Click here to start your quality small company portfolio now
What this screen does for you
Gross Margin (Marx)
Gross Margin (Marx) is the best measure of company quality we have tested so far.
It is calculated as: Gross profits / Total assets.
Set the slider below Gross Margin (Marx) from 0% to 30% to select the 30% of companies in the database with the highest gross profit margin.
Piotroski F-Score
The Piotroski F-Score is another very good indicator of company quality.
Set the slider below the Piotroski F-Score from 0% to 20% to only select companies with the highest (best) F-Score of 8 or 9.
MV Size
MV Size is an indicator you can use to select companies with a certain market value.
As we want to only select small companies I have set the slider to 70% to 100%. This will select the 30% of companies in the database with the lowest market value.
Countries
In the drop down list below Countries you can select all the countries you want to invest in.
In the screen I have selected the main stock markets world-wide.
Daily Trading Volume
In the Daily Traded Volume field I entered $50,000 to make sure that you can easily buy and sell the companies the screener comes up.
You can change this value to one you feel comfortable with.
Buy the most undervalued companies
As the above screen will most likely give you quite a large list of companies I suggest that you buy the 40 most undervalued companies based on QI Value.
QI Value is a ranking system we developed based on all the best valuation ratios and indicators we have tested.
QI Value ranks all the companies in the database based on:
- EBITDA Yield = Earnings before interest, taxes, depreciation and amortisation (EBITDA) / Enterprise Value
- Earnings Yield = Operating Income or earnings before interest and taxes (EBIT) / Enterprise Value
- FCF Yield = FCF (Free cash flow) Yield is calculated as Free Cash Flow / Enterprise Value
- Liquidity (Q.i.) = Adjusted Profits / Yearly trading value.
You can read more about QI Value in this article: This outperforms all other valuation ratios (14 year back test result)
Sort by QI Value
To find the most undervalued companies based on QI Value put your cursor over the heading QI Value (until it changes to look like a small hand) and click on the column heading. This will sort the column by the QI Value ranking.
Make sure the column is sorted from small to large as the most undervalued companies have the smallest QI Value ranking. If the column is not sorted from small to large simply click the column heading again.

How to sort companies by using the QI Value indicator
What about shorting junk – easier said than done
What about shorting junk small companies as the researchers did in the paper you may be thinking?
That’s a good question and is easier said than done.
Firstly small companies are not easy to short because before you can find shares to short your broker has to find someone that is willing to lend you the shares to sell (go short). And for small companies you may not find anyone willing to lend you shares.
Secondly with shorting your profits are limited to 100% (if the share price goes to zero) but your losses are unlimited as there is no limit on how high the share can go.
I don't like the possible return profile of shorting and thus do not recommend it.
How to find junk small companies to short
I can however show you how to easily find junk companies.
In the screen all you do is simply choose the companies with the lowest Gross Margin (Marx) and the lowest Piotroski F-Score.
You can also add the Montier C-Score to the screen.
The Montier C-Score is an indicator developed by James Montier to identify companies that were cooking the books. It is an excellent tool to help you find companies to short.
You can read more about the Montier C-Score here: Simple ratios help you identify companies that cook their books – The C-Score
PS: To get quality small company investment ideas working in your portfolio sign-up right now.
PPS Why not sign up now before it slips your mind?
Click here to start your quality small company portfolio now


