In March 2016 Jim O’Shaughnessy (O’Shaughnessy Asset Management) published an interesting research paper called A True Microcap Investment Strategy.
The paper made a really convincing argument for investing in microcap companies (for exact returns continue reading), it is also the strategy they follow in their Micro Cap investment strategy.
What is a microcap company?
In the paper Jim defined a microcap companies as companies with a market value of between $50m and $200m.
As a private investor microcaps are one of the few market areas where you have an advantage over fund managers and other large investors, because these companies are simply too small for them to be able to invest a meaningful amount of money in.
They are also never mentioned in the media which also keeps then under the radar of most investors.
For example, when was the last time you heard anybody on television or a popular website speak or write about a company with a market value of less than $200 million.
It simply doesn't happen.
Why are microcap companies attractive?
These are the reasons Jim gave why microcap companies can give you consistent long term market beating returns:
- Little or no research published on these companies
- Investment and hedge funds can't invest in these companies because they are just too small. An investment in microcap companies is too small to make a difference to their returns.
- In the past microcap companies have proven to be the highest source of market outperformance in the US markets.
- Because these companies get so little interest from investors they very often trade a lot lower than what they are really worth.
- Because there are such a large number of microcap companies they are ideally suited to a quantitative investment process.
- Other research Jim has done has shown that microcap companies are a good alternative to private equity investments.
- Microcap companies are very good takeover candidates as proven by more than 17 companies in Jim’s microcap portfolio that have been taken over between 2012 and 2016.
Also if you follow a microcap investment strategy it doesn't mean that your portfolio is illiquid. Jim found that these companies trade enough for you to buy and sell on a daily basis.
How many microcap companies are there?
When Jim published the research paper in March 2016 he calculated that they were 1,108 microcap companies in the US. The market value of all these companies together was less than the market value of Pfizer alone.
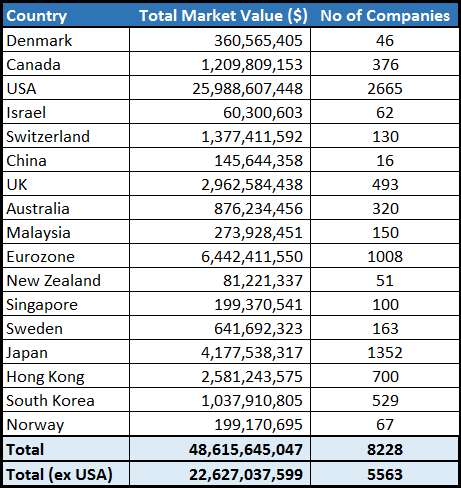
Apart from the USA the Quant Investing stock screener database has a total of 5,563 companies with a market value of between $50m and $200m. And all these companies together have a market value of $22.6 billion.
Companies in the screener with a market value of between $50m and $200m
[I do not know why the screener shows 2665 microcap companies compared to the 1108 Jim mentioned. He may have referred to only quality microcap companies.]

Just 5% of the market value of Microsoft
$22.6 billion is only 5.2% of the market value of Microsoft Corporation, or equal to the market value of Devon Energy Corp. a company you have probably never heard of (I haven’t).
This just shows you why microcap companies are of no interest to large fund managers or hedge funds. They simply cannot invest a large enough amount of money in these companies.
This means they are perfect for private investors like you and me.
But how do you select high return market beating microcap companies you may be thinking?
Click here to start finding True Microcap investment ideas NOW!
Quality is very important
I'm sure if you've even just taken a slight interest in microcap companies you would have realised that a lot of these companies are really junk.
With junk I mean they have low or no profits, high debt, generate a low return on equity, have no or low earnings growth and have weak or no cash flow generation.
That's why you must make sure that you only look at high quality companies.
Jim used the following ratios to find high quality microcap companies:
- Change in debt
- Net external financing
- Return on Equity
- One year earnings growth
- Non-cash earnings to assets
- Free cash flow yield
Do not worry if this looks intimidating. The stock screener makes it easy for you to find high quality microcap companies, you simply select the ratios and the screener shows you only high quality companies of which you can select the most undervalued.
But more on that later…
Value and momentum work well with small companies
After getting rid of low quality companies Jim used a few valuation and momentum ratios (he suggest you use more than two ratios for both) to select microcap companies to invest in.
To find undervalued companies he used:
- Price to earnings
- Price to sales
- Free cash flow to enterprise value
- EBITDA to enterprise value
He says that even though each of these ratios may not always work, the combination of ratios gives you the best indication that a company is cheap.
Momentum and volatility
To identify companies with good (upward moving) price momentum Jim used 3, 6 and 9 month momentum as well as 12 month return volatility to select companies with low price volatility (large up and down movements in price).
Click here to start finding True Microcap investment ideas NOW!
Does it work?
I have left the most important question for last. Does Jim’s microcap investment strategy work?
Here is a summary of the back tests Jim did:

Source: O’Shaughnessy Asset Management
Buying the cheapest
Jim back tested investing in the cheapest 10% US microcap companies in the 45 year period between 1970 and 2015.
If you invested $10,000 in this strategy in 1970 in 2015, adjusted for inflation, your portfolio would have grown to $6.5 million.
That is total return of 64900% and an average compound yearly return of 15.5% which would have given you 650 times your original capital.
If you over the same period invested the same $10,000 in the most undervalued 10% of large companies your portfolio would have grown to only $1.5 million, a return of 14900% or annual compound return of 11.8%.
All the strategies were re-balanced on a yearly basis.
I am not sure of this S&P 500 return
Over the same 45 year period the S&P 500 returned 263.5% or 2.9% per year.
This looks quite low but Jim did not give the index returns and I could not find a better after inflation return calculator for the S&P 500. Please let me know if you have a better source.
Buying those with the best momentum
Jim also tested the microcap strategy if you only invested in companies with the highest price momentum.
If you invested $10,000 in a microcap high momentum strategy over the 45 year period from 1970 to 2015 your $10,000 investment would have grown to an inflation-adjusted $2.7 million.
That is total return of 26900% and an average compound yearly return of 15.5% which would have given you 270 times your original capital.
The same investment made in large companies with strong momentum grew to only $609,000 after inflation. That is total return of 5990% and an average compound yearly return of 9.6%.
Combining value and momentum
Jim unfortunately did not include the return of his combined value and momentum investment strategy simply saying that their testing found that combining value and momentum led to strong and consistent returns.
We back tested value and momentum investment strategy, with very good results, in this article: 1374.2% return from neglected, value and momentum companies.
How to find these companies in the screener
Even though the microcap strategy may look complicated, with the stock screener, it is very easy to find companies that meet all ratios and indicators Jim used.
First select only microcap companies
The first thing you have to do is make sure the screener only looks at microcap companies.
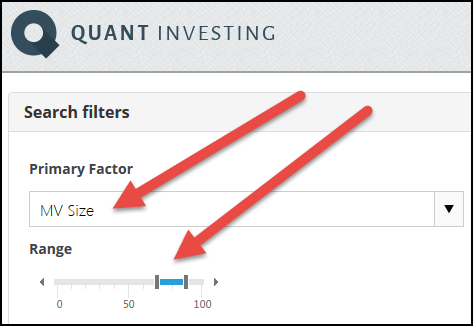
The MV Size indicator in the screener allows you to do this.
Select microcap companies by move the slider to select 70% to 90% (the smallest companies in the data base have a value of 100%).

If you want to include even smaller companies you can set the slider from 70% to 100%.
Next only include quality companies
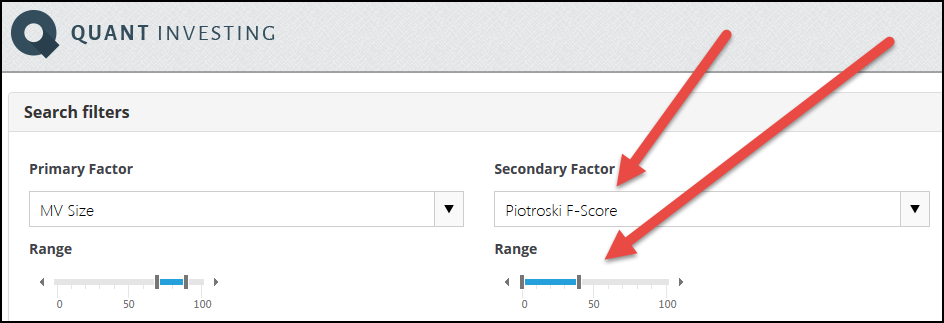
To get rid of the lowest quality companies screen for companies with a Piotroski F-Score of larger than 5 or 6.
To do this you can either use the slider or the filter function in the column heading (enter a value and click on the funnel icon) as shown below.

How to add the Piotroski F-Score
The Piotroski F-Score helps you find quality companies with its nine point scoring system that is made up of the following ratios and indicators:
Profitability
1. Return on assets (ROA)
Net income before extraordinary items for the year divided by total assets at the beginning of the year.
Score 1 if positive, 0 if negative
2. Cash flow return on assets (CFROA)
Net cash flow from operating activities (operating cash flow) divided by total assets at the beginning of the year.
Score 1 if positive, 0 if negative
3. Change in return on assets
Compare this year’s return on assets (1) to last year’s return on assets.
Score 1 if it’s higher, 0 if it’s lower
4. Quality of earnings (accrual)
Compare Cash flow return on assets (2) to return on assets (1)
Score 1 if CFROA>ROA, 0 if CFROA<ROA
Funding
5. Change in gearing or leverage
Compare this year’s gearing (long-term debt divided by average total assets) to last year’s gearing.
Score 1 if gearing is lower, 0 if it’s higher.
6. Change in working capital (liquidity)
Compare this year’s current ratio (current assets divided by current liabilities) to last year’s current ratio.
Score 1 if this year’s current ratio is higher, 0 if it’s lower
7. Change in shares in issue
Compare the number of shares in issue this year, to the number in issue last year.
Score 1 if there is the same number of shares in issue this year, or fewer. Score 0 if there are more shares in issue.
Efficiency
8. Change in gross margin
Compare this year’s gross margin (gross profit divided by sales) to last year’s.
Score 1 if this year’s gross margin is higher, 0 if it’s lower
9. Change in asset turnover
Compare this year’s asset turnover (total sales divided by total assets at the beginning of the year) to last year’s asset turnover ratio.
Score 1 if this year’s asset turnover ratio is higher, 0 if it’s lower
What the F-Score means?
Piotroski or F-Score = 1 + 2 + 3 + 4 + 5 + 6 + 7 + 8 + 9
Good or high score = 8 or 9
Bad or low score = 0 or 1
As you can see the Piotroski F-Score is a ready good indicator to identify quality companies and to identify companies with good fundamental momentum.
You can find more information about the Piotroski F-Score here:
This academic can help you make better investment decisions – Piotroski F-Score
Can the Piotroski F-Score also improve your investment strategy?
Click here to start finding True Microcap investment ideas NOW!
Find undervalued companies
After you have gotten rid of low quality companies the next step of the microcap strategy is to find undervalued companies.
To do this Jim used these four ratios:
- Price to earnings
- Price to sales
- Free cash flow to enterprise value
- EBITDA to enterprise value
You can easily find them all in the screener as shown in the following screenshot:
These combined ratios make it easier for you
You are of course welcome to use the above four valuation ratios or you can use the combined ratios we have already built into screener for you.
Combined ratios are simply a few ratios we have combined into one ratio in the screener. They make the whole screening process easier because you only select one ratio and it does the work of a few ratios. This also means you have more sliders free to select other ratios.
The combined ratios may not have the exact four ratios mentioned above but they will work just as well.
Here are some of the combined ratios available in the screener.
Value Composite One
Value Composite One was developed by Jim O’Shaughnessy and explained in the latest edition of his book What Works on Wall Street: The Classic Guide to the Best-Performing Investment Strategies of All Time.
Value Composite One is calculated using the following five valuation ratios:
- Price to book value
- Price to sales
- Earnings before interest, taxes, depreciation and amortization (EBITDA) to Enterprise value (EV)
- Price to cash flow
- Price to earnings
In the screener the Value Composite One has a value of between 0 (undervalued company) and 100 (expensive or overvalued company).
Value Composite Two
Value Composite Two is calculated the same as Value Composite One but it adds an additional ratio, Shareholder Yield.
Shareholder yield is calculated as Dividend yield + Percentage of Shares Repurchased
Qi Value
Qi Value is an indicator we developed based on all the research we have done that gave the highest returns. This is the combined ratio I use to find investment ideas.
Qi Value is calculated with the following ratios indicators:
- EBITDA Yield
- Earnings Yield
- FCF Yield
- Liquidity (Q.i.)
Liquidity (Q.i.) is calculated as Adjusted Profits / Yearly trading value. It gives you an indication of how high a company’s yearly traded value per share is compared to its adjusted profits.
A high value thus means low turnover and thus a larger chance of the company’s shares being miss-priced.
Find companies with good momentum and low volatility
The final step in the microcap strategy is to find companies with good momentum and low share price volatility.
Jim used the following four ratios to do this:
- 3 month momentum
- 6 month momentum
- 9 month momentum
- 12 month return volatility to select companies with low price volatility (large up and down movements in price).
Even though all these ratios are available for you to use in the screener our back testing have shown that you can get 80% of the benefit of momentum by just using 6 months momentum.
I only use 6 months momentum when selecting ideas for my portfolio.
Click here to start finding True Microcap investment ideas NOW!
In summary - putting it all together – the final screen
All the above steps may sound complicated but it is really simple.
All you have to do is select the following four criteria in the screener:
The last thing you have to do
The only other thing for you to do is to select:
- What countries you want to search for ideas in
- The minimum daily traded value the companies must have (so you can buy and sell easily)
This is all very easy with the screener as you can see below.

Click image to enlarge
There you have it, your own personal microcap investment strategy that is simple and easy to set up and use.
PS To start using this microcap strategy in your portfolio right now sign up here
PPS It's so easy to get distracted, why not sign up right now while it's still fresh in your mind?
Click here to start finding True Microcap investment ideas NOW!


