
Do you know that you can group the results of any screen you run with the Quant Investing stock screener?
You can group results by any of the ratios or indicators in the columns you have selected. This is helpful to see if there are any industry or country concentrations in your screen, for example.
It of course is only helpful to group results if the same value appears a few times, for example with the following factors or ratios:
- Country
- Industry
- Piotroski F-Score
- Financial Statement Date
- Qi Value
- Value Composite One
- Value Composite Two
- ERP5
- Magic Formula (MF Rank)
How to group your results
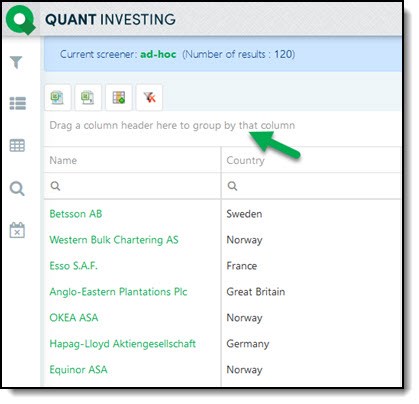
To group the results simply drag the column heading into the field shown below.
To group results drag the Country heading into the top line as shown by the arrow.
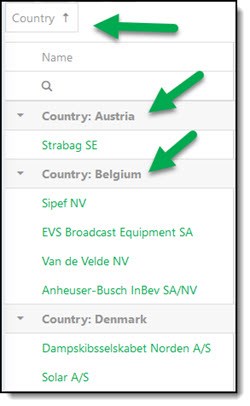
Grouped stock screener results look like this:
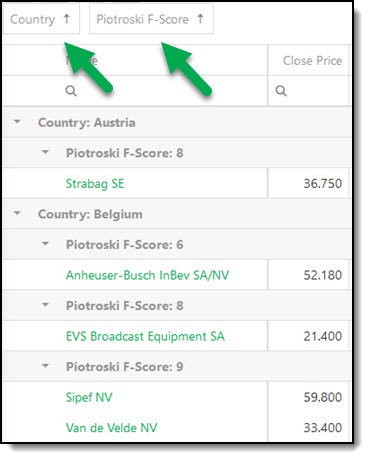
You can also group by more than one ratio
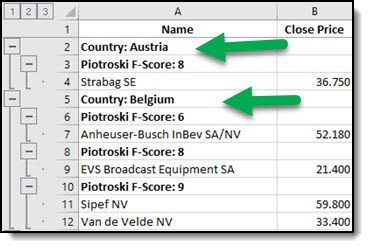
You can also group your results by more than one factor. In this example I grouped the results of a screen by Country and Piotroski F-Score:
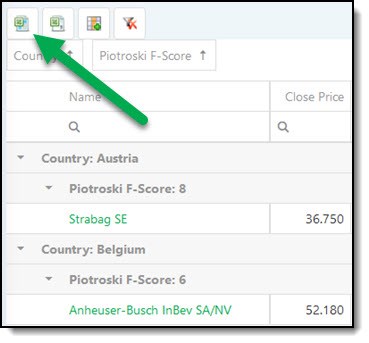
Also works with export to Excel
The grouping you selected can also be exported to Microsoft Excel.
To export the result of your screen click on the Export data to MS Excel icon.
The export looks like in Microsoft Excel:
PS To start finding market beating investment ideas with the Quant Investing stock screener sign up right here.
PPS It is so easy to put things off, why don’t you sign up right now