The Golden Cross ratio called Cross SMA 50/200 in the screener is calculated as the 50 day simple moving average / 200 day simple moving average.
SMA stands for Simple Moving Average.
How to interpret the Golden Cross
If the Cross SMA 50/200 value is > 1 the 50 day moving average is above the 200 day moving average, this is a positive share price momentum indicator.This means the share price may continue to move higher.
If the value is < 1 it means the 50 day moving average is below the 200 day moving average, and this is an indicator that the share price may go lower.
How to use it
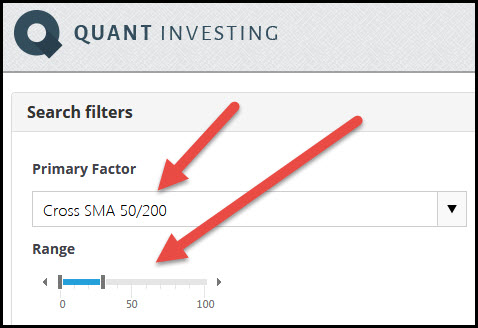
This is how you can use it to select companies with a positive (value > 1) using the screener:

How to select positive golden cross companies
How to select golden cross companies
To select companies where the 50 day moving average is higher than 200 day moving average position the sliders from 0% to 30%.
To select companies where the 50 day moving average is below the 200 day moving average set the sliders from 70% to 100%.
To find companies where a golden or death cross has just taken place (the 50 day moving average has just crossed the 200 day moving average) set the sliders from 30% to 70%.
See the golden cross values
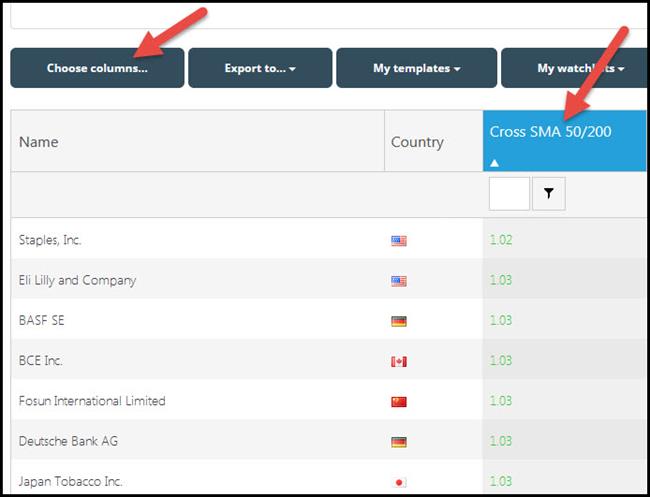
You can of course also see the golden cross values of the companies in your screen.
To do this click on the Choose columns button and select Cross SMA 50/200 as one of your output columns.

Show the golden cross values of all the companies in your screen
How to sort the column
Clicking on the column heading (Cross SMA 50/200 in this case) sorts the values in the column. If you click once it sorts from low to high, when you click the second time it sorts the column from high to low.
You can find more information here:
You can find more information on the Golden cross here: How to use the golden cross to increase your returns
Click here to start using the Golden Cross in your portfolio NOW!

