
We just added a market dashboard that shows you what sectors of the market (utilities, REIT’s, financial and bonds) are doing in terms of momentum.
We called this tool the Tactical Asset Allocation Dashboard and it can help you to see what sectors are under-performing and outperforming the market at the moment.
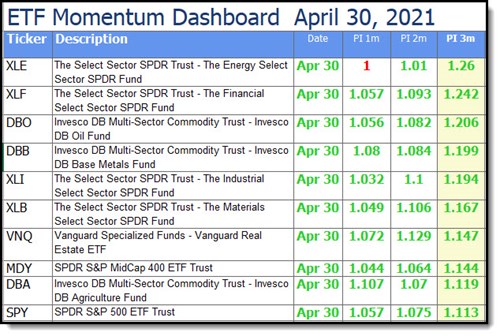
Here is a screenshot of the ETF Momentum Dashboard:
Quickly see what sectors are moving world-wide
The next file is called ETF Momentum Dashboard and is an Excel file that shows you the share price momentum of over 43 Exchange Traded Funds (ETF) worldwide.
This gives you an a unique insight as to what industries have been moving up and down over the short (from 1 month) to medium (36 months) term. This can help you to identify profitable trends to invest in.
You can also see four moving average direction indicators from 20 to 200 days.
How to use it
If market sector momentum changes (either up or down) you will see it first in short term momentum (PI 1 month), and if the trend continues you will see it confirmed by medium (PI 2 months) and long term momentum (PI 3-6 month).
Remember to watch short term momentum carefully as it is known to change direction quickly and it is not uncommon to see several months of momentum reversed in a short period of time.
Check back often
The table is updated weekly - every Monday morning - so add the page to your favourites so you can check it often.