
What is good fundamental momentum?
Good fundamental momentum simply means companies with improving financial health as measured with the Piotroski F-Score.
A new report - improving Piotroski F-Score
We have added a new report to the screener that shows you how to find undervalued companies with an improving Piotroski F-Score.
In other words cheap companies with good fundamental momentum.
But before I show you where you can find the report and all the information it includes, first some information on why the Piotroski F-Score is an indicator you should not ignore.
Why the Piotroski F Score is an indicator you should not ignore +210% improvement
I'm a big supporter of the Piotroski F-Score because a lot of testing we've done have shown that, on average, it improved the investment returns 13 investment strategies by 210% over 12 years.
You can read the full article here: Can the Piotroski F-Score also improve your investment strategy?
What is the Piotroski F score?
The F-Score is not difficult to calculate if you have all the information. It measures how certain financial ratios and numbers have changed over time and gives you a score of between 0 (bad) and 9 (good).
All you have to do to get the benefit of the F-Score is to only invest in companies with a good F-Score (F-Score of 7, 8 or 9).
You can read more about the F-Score, how it is calculated, and how it improved the returns of numerous investment strategies in the following article: This academic can help you make better investment decisions – Piotroski F-Score
Now back to the new report we have added to the screener.
Improving Piotroski F score
The report shows you what companies, that are already undervalued, have a good Piotroski F score that has improved.
Here is what the report looks like:
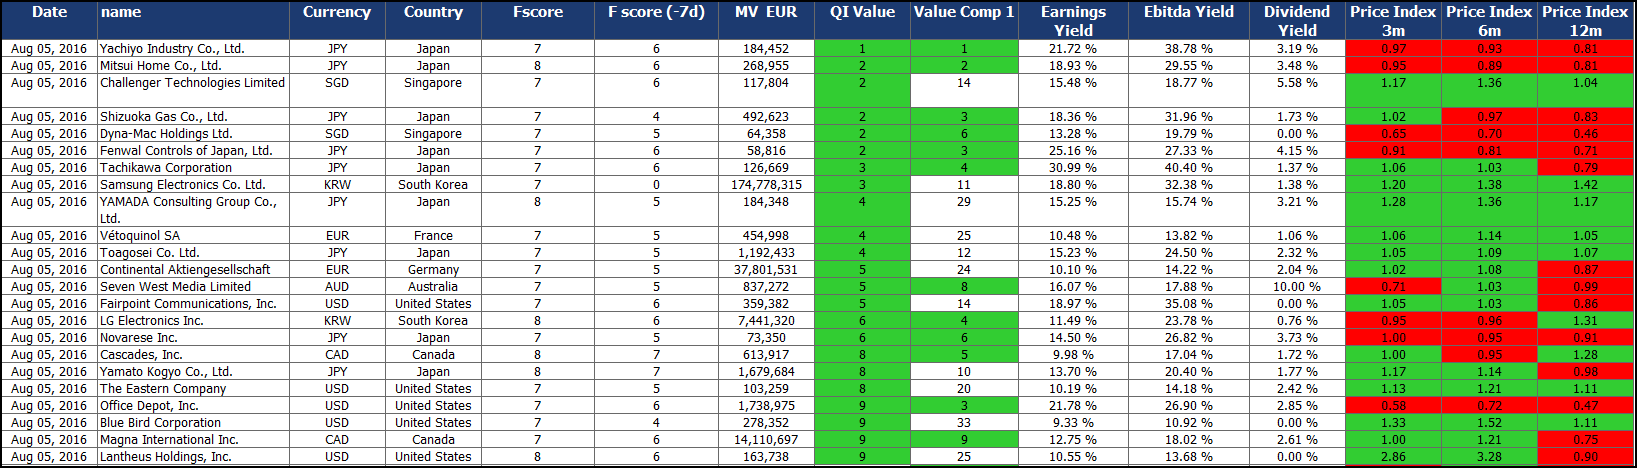
Click image to enlarge
As you can see the report shows your list of undervalued companies with a Piotroski F-Score that has improved since the last financial statement update.
What do all the columns mean?
The following is an explanation of the columns in the report:
- Fscore shows you the current F-Score;
- F score (-7d) the old or pervious F-Score;
- MV EUR gives you the current market value of the company in thousands of Euro (000) to give you an idea of how big the companies are
- QI Value (value the list is sorted by) is our own developed rating system to help you find undervalued companies based on four of the best performing ratios we have tested. You can read more about the Qi Value ranking in this article: This outperforms all other valuation ratios (14 year back test result);
- Value Comp 1 (Value Composite One) is also an indicator that used five ratios, to help you identify undervalued companies. You can read more about Value Composite One here: This combined valuation ranking gives you higher returns - Value Composite One;
- Earnings Yield gives you the current Earnings Yield (EBIT/Enterprise Value) of the company;
- Dividend Yield shows you what the current dividend yield of the company is;
- Price Index 3m shows you the three month share price momentum (current share price / share price 3 months ago) of the company;
- Price Index 6m shows you the six month share price momentum (current share price / share price 6 months ago) of the company;
- Price Index 12m shows you the one year share price momentum (current share price / share price 1 year ago) of the company;
So, as you can see the report gives you a lot of practical information.
How to use it
The report shows you undervalued companies, identified 5 different ways, which have improvement their F-score.
Combined with momentum
The report also shows you the 3, 6 and 12 month share price momentum of these companies which means you can easily implement the strategy of combining:
- An undervalued company,
- Healthy financial condition (high F-Score),
- That is improving (improving F-Score) and
- Positive share price momentum (increasing share price).
Basically all the information you need to decide if a company is worth researching further.
Where can I find the report?
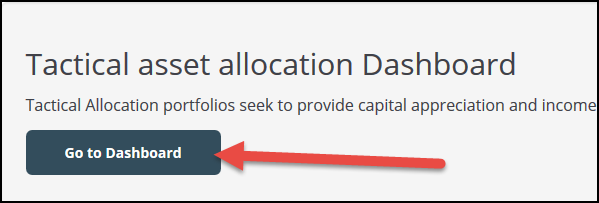
We have added the report to the Dashboard page on the website.
After you have logged in, scroll down and under the heading Tactical asset allocation Dashboard click on the Go to Dashboard button.
Scroll down on the next page to the bottom of the page and click on the file called “Improved_F-Score”
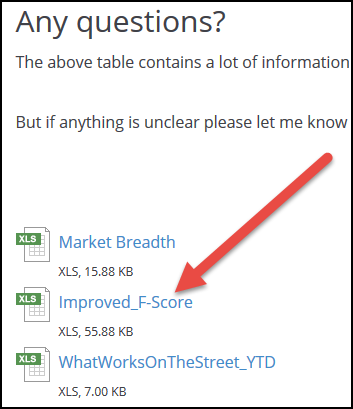
What are in all the other files?
Along with the file above you will see a lot of other files.
To find out more on how you can profit from the information in these files take a look at the following article: These new tools will give you even more good investment ideas
PS To get immediate access to this report (as well as 10 other report) and the screener, at a cost of less than an inexpensive lunch for two, click here: Sign me up for the screener
PPS It is so easy to put things off and forget, why not sign up right now?