To help you find even better investment ideas we added a report that helps you find undervalued companies with an already good AND improving F-Score.
This is what it looks like:
What do all the columns mean?
The following is an explanation of the columns:
- Fscore shows you the current F-Score;
- F score (-7d) the old or pervious F-Score;
- MV EUR gives you the current market value of the company in thousands of Euro
QI Value (value the list is sorted by) is our own developed rating system to help you find undervalued companies based on four of the best performing ratios we have tested. You can read more about the Qi Value ranking in this article: This outperforms all other valuation ratios (14 year back test result); - Value Comp 1 (Value Composite One) is an indicator that uses five ratios to help you identify undervalued companies. You can read more about Value Composite One here: This combined valuation ranking gives you higher returns - Value Composite One;
- Earnings Yield is the current Earnings Yield (EBIT/Enterprise Value) of the company;
Dividend Yield shows you what the current dividend yield of the company is; - Price Index 3m shows you the three month share price momentum (current share price / share price 3 months ago) of the company;
- Price Index 6m shows you the six month share price momentum (current share price / share price 6 months ago) of the company;
- Price Index 12m shows you the one year share price momentum (current share price / share price 1 year ago) of the company;
As you can see the report gives you a lot of useful information.
This F-Score report is updated daily
You can find a daily updated improving F-Score report on the website. Here is how you can get hold of it.
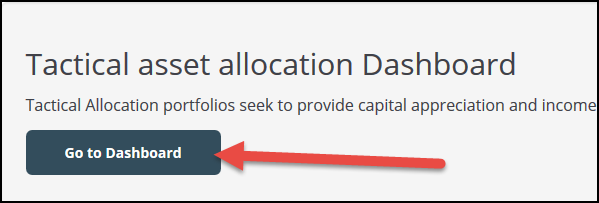
We add the report to the Dashboard page on the website.
After you have logged in, scroll down the page and click on the Go to Dashboard button.

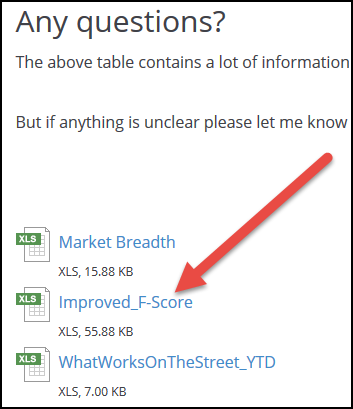
On the next page click on the file called “Improved_F-Score”

What are in all the other files?
Along with the improved F-Score report you will see a lot of other files.
To find out how you can profit from the information in these files take a look at the following article: These new tools will give you even more good investment ideas
PS To get unlimited access to the Improved F-Score report as well as over 110 ratios and indicators to find investment ideas sign up for the screener, it costs less than an inexpensive lunch for two.
PPS It is so easy to put things off. Why not sign up now?


