Screenshots of the Quant Investing stock screener
Here are a few screenshots of the screener to give you an idea of how easy it is to use.
When you start
This is what the stock screener looks like when you open it.
As you can see there are four sliders you can use to quickly screen for exactly the type of companies you are looking for.

Click image to enlarge
More than 110 ratios and indicators
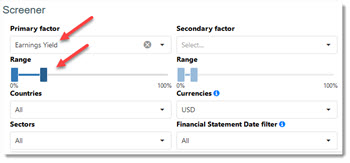
The screenshot below shows one of the more than 110 ratios or indicators you can screen with. By moving the slider (below) you can use to limit the results of the selected ratio or indicator.
For example 0% to 10% will only select the top 10% (highest earning yield) of companies in of the more than 22 000 companies in the database.
Click image to enlarge
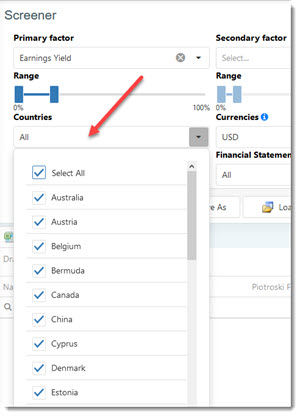
Select the countries
Here you can see what the country selector looks like.
Click image to enlarge
Select your currency
This image shows you where you can select the currency that is applied to the Daily Trading Volume and Market Value fields (all numbers in thousands 000).
For example in the image below only companies will be shown that:
- Has a Daily Trading Volume of at least $125 000 per day, AND
- Has a Market Value (Market Cap) of at least $65 million

Click image to enlarge
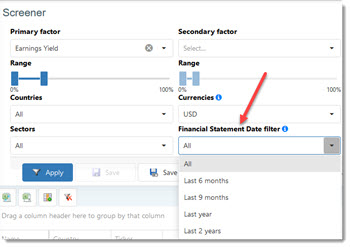
How recent must the results be?
This image shows how you can make sure that only the most recent company financial results are used in your screens. You simply select the time period in which the company's financial results were last updated.
Click image to enlarge
Results for a single company
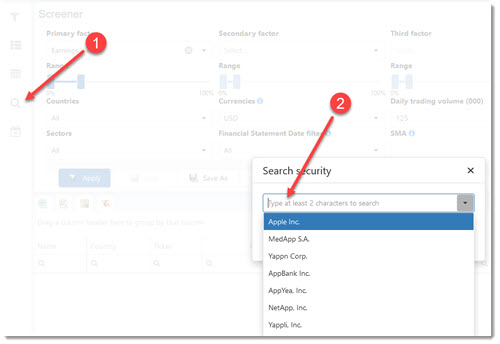
You can use the Security Search icon on the left to find financial information on a specific company you are interested in.
In the screenshot below I clicked on the search icon (1) then in the search box (2) I entered "app" and the list of companies appeared below the search box.
Click image to enlarge
Choose the columns you want to see
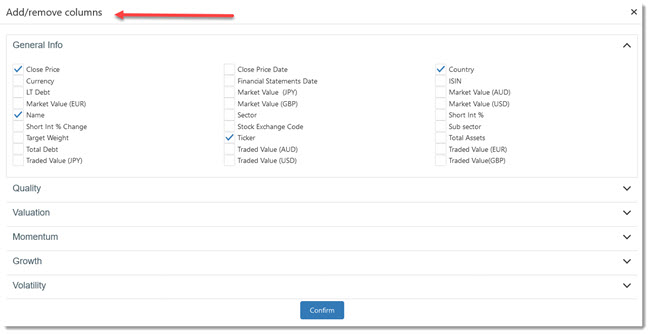
This screenshot shows you one page (you have a total of six) where you can select all the company ratios and indicators (shown as columns) that you want to see when you run your screen.
You can save all the ratios you selected and even link it to a saved stock screen so they are shown automatically when you load the screen. To see exactly how this is done look at this article: How to create and edit Templates in the Quant Investing stock screener
The column sequence is also saved so it is great for further analysis in a spread sheet.
Click image to enlarge
Export your screener output
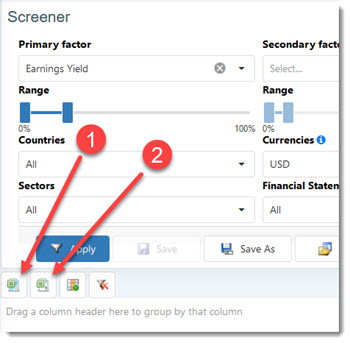
The following image shows how you can export the results of any screen for further analysis either as a Microsoft Excel spread sheet (1) or as a CSV file (2).
Click image to enlarge
Save and load all your favourite screens - 2 mouse clicks
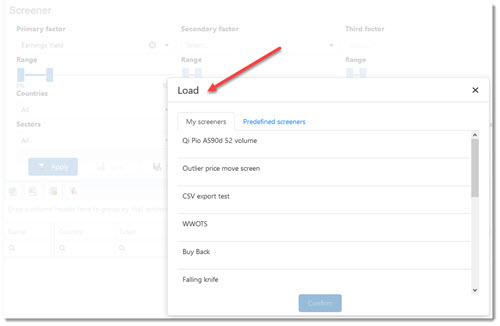
By clicking on Load button you instantly load any of your saved stock screens (no limit on how many you can save) within a few seconds with two mouse clicks.
Click image to enlarge
Pre-defined screens you can use immediately
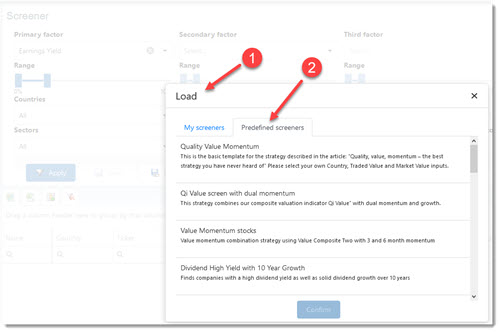
To help you get started fast we have saved over 22 stock screens of well-known investment strategies as well as screens with really good back tested results for you. which you can start using immediately.
To load then click on the Load button (1) then click on the Predefined Screens tab (2) as shown in the screenshot.
Click image to enlarge
Get email updated of your stock screens
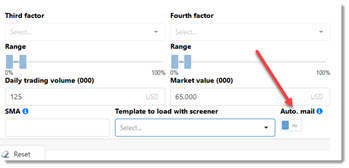
By simply activating one small setting you can get an email update if a new company meets all the requirements of your screen. You can set up save as many screens as you like to get email updates for.
To activate this feature simply click the Auto. mail slider from No to Yes.
Click image to enlarge
Glossary always at hand
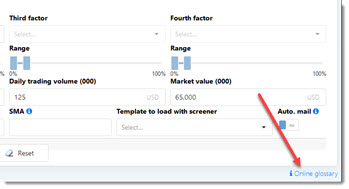
By clicking on the Online glossary hyperlink shown below you can quickly and easily find the exact definition of all the ratios and indicators you can use in the screener.
Click image to enlarge
I want to start screening right now, please sign me up!

