

High Free Cash Flow Yield Investment Strategy
I am sure you agree that a High Free Cash Flow Yield - defined as free cash flow divided by enterprise value, as well as five year average free cash flow yield are great ratios you can use to find market beating investments.
But do they work?
High Free cash flow yield tested over 12 years
That is what we set out to do with the research report Quantitative Value Investing in Europe: What works for achieving alpha.
In the research paper we tested what returns these ratios would have given you if you used them to invest in European companies over the 12 year period 13 June 1999 to 13 June 2011.
A High Free Cash Flow Yield Strategy Can Be Improved
We also tested what would have happened if you combined a high free cash flow yield with 13 other ratios and indicators because, as you have seen with other one ratio investment strategies, the combination with other ratios can improve your returns substantially.
Before I show you the returns first some information on how we tested.
Click here to start using High Free Cash Flow Yield in your portfolio Now
Methodology
We only use historical accounting data and no forecasts. The reason being is that there is ample evidence that forecasts cannot be relied on. For example, in his excellent book, ‘The New Contrarian Investment Strategy’, David Dreman mentioned a study that used a sample of 67.375 analysts' quarterly estimates for companies listed on US stock exchanges.
The study found that the average analysts’ error was 40%, and that the estimates were misleading two-third of the time!
The backtest universe and benchmark
Our backtest universe is a subset of companies in the Datastream database containing an average of about 1500 companies in the 17 country Eurozone market during our 12-year test period (13 June 1999 to 13 June 2011).
We excluded banks, insurance companies, investment funds, certain holdings companies, and REITS.
We included bankrupt companies to avoid any survivor bias. Bankrupt companies, or companies that were taken over, returns were calculated using the last stock market price available before the company was delisted.
We excluded companies with an average 30-day trading volume of less than €10 000.
It was not a good time to invest
The test period was most certainly not a good time to be invested in stocks.
The 12-year period we tested included a stock market bubble (1999), two recessions (2001, 2008-2009) and two bear markets (2001-2003, 2007-2009).
In spite of all the substantial movements, over the whole period it was essentially a sideways market, as Vitaliy Katsenelson defined in his book, ‘The Little Book of Sideways Markets’.
Holding periods and quintile tests
Each year all the portfolios we tested were formed on 16 June. We chose 16 June as most European companies have a December year-end and by this date all their previous year-end results would be available in the database.
The annual returns for our back test portfolios were calculated as the 12-month price change plus dividends received over the period. Returns were compounded on an annual basis.
This means each year the return of the portfolio (dividends included) would be reinvested (equally weighted) in the strategy the following year.
The portfolios were all constructed on an equal-weighted basis.
In order to test the effectiveness of a strategy, we divided our back test universe into five equal groups (quintiles), according to the factor we were testing. For example, when testing a low price-to-book (PB) value strategy, we ranked our back test universe from the cheapest (lowest PB) to the most expensive (highest PB) stocks.
The cheapest 20% of companies were put in the first quintile (Q1), the next in the second, and so on, with the 20 % of companies with the highest price-to-book value in the fifth quintile (Q5).
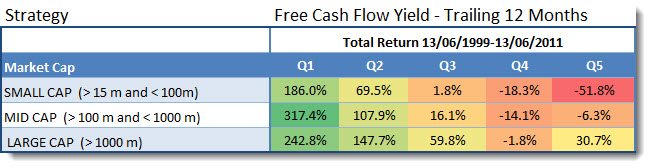
Trailing 12 Months High Free Cash Flow Yield
We first tested if you used only a strategy of buying the 20% of companies with the highest trailing 12 months Free Cash Flow (FCF) Yield.
These are the returns the strategy generated:
Click image to enlarge
Source: Quantitative Value Investing in Europe: What works for achieving alpha
Q1 (Quintile 1) represents the cheapest 20% of companies in terms of free cash flow yield and Q5 (quintile 5) the most expensive.
High free cash flow yield companies are winners
As you can see the highest free cash flow yield companies (Q1) substantially outperformed, not only the low free cash flow yield companies (overvalued companies), but also the market, which over the same 12 year period returned 30.54%.
The strategy also worked best for medium sized companies.
Click here to start using Free Cash Flow Yield in your portfolio Now!
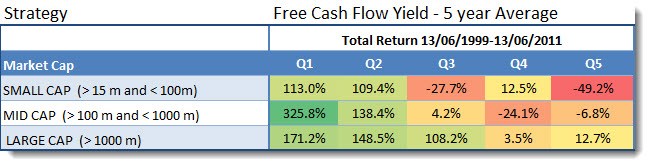
High Free Cash Flow Yield 5 Year Average
The table below shows the returns you could have generated if you invested in companies with the highest five year average free cash flow yield.
Five year average free cash flow yield is defined as: Five year average FCF / Current Enterprise Value
Free cash flow is defined as cash from operations - capital expenditure.
Click image to enlarge
Source: Quantitative Value Investing in Europe: What works for achieving alpha
Q1 (Quintile 1) represents the cheapest 20% of companies in terms of five year average free cash flow yield and Q5 (quintile 5) the most expensive.
This strategy also worked best for medium sized companies but what is noticeable is that the returns are not linear (steadily decreasing) if you look from Q1 to Q5. This means this is not a very good ratio to use if you are looking for market beating investment ideas.
We thus did not use five year average free cash flow yield as a ratio to test along with other investment strategies.
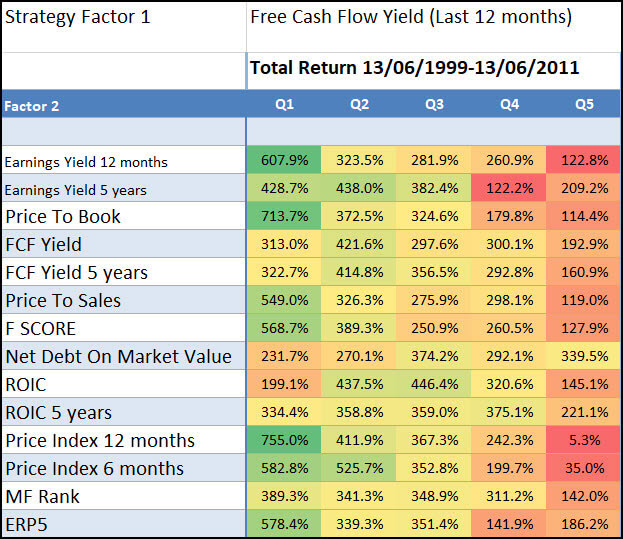
Improve your high free cash flow yield returns
The following table shows your returns if you can combine high free cash flow yield companies with 13 other ratios and indicators.
Click image to enlarge
Source: Quantitative Value Investing in Europe: What works for achieving alpha
Best combination – Momentum
As you can see the best way to increase your return (+755.0%) was to combine free cash flow yield with Price Index 12 months (12 months momentum).
Exact definition – in glossary
If any of the above terms are unclear you can find the exact definition of all the ratios and indicators in the Glossary.
How to easily implement a high free cash flow yield investment strategy
Read this article to find out how easy it is to implement a high free cash flow yield investment strategy in your portfolio: Why and how to implement a high free cash flow yield investment strategy
PS To start getting high Free Cash Flow Yield investment ideas for your portfolio right now sign up here.
PPS It is so easy to put things why don't you sign up now before it slips your mind?
Click here to start using High Free Cash Flow Yield in your portfolio Now!