

Price to Book and Piotroski F-Score Investment Strategy
The Price to Book ratio (Current share price / Book value per share) is a good ratio to to find undervalued investment ideas. It has been tested in numerous research papers, over long periods of time, and is an investment strategy that outperforms the market.
Price to Book can be improved a lot
But, as with all single ratio investment strategies, it can be substantially improved.
Before we get to that here are the back tested returns you could have earned if you used a low Price to Book (PB) investment strategy to invest in Europe over the 12 year period 13 June 1999 to 13 June 2011.
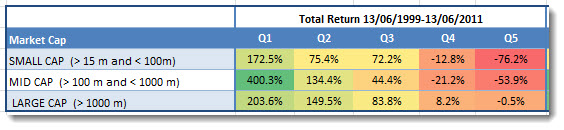
Click image to enlarge
Source: Quantitative Value Investing in Europe: What works for achieving alpha
Q1 (Quintile 1) represents the cheapest 20% of companies in terms of PB and Q5 (quintile 5) the most expensive.
The lowest PB companies (Q1) substantially outperformed the market, which over the same 12 year period returned 30.54%.
Before I show you how to improve the returns of a low price to book investment strategy first some information on how we tested.
Methodology
We only use historical accounting data and no forecasts. The reason being is that there is ample evidence that forecasts cannot be relied on. For example, in his excellent book, ‘The New Contrarian Investment Strategy’, David Dreman mentioned a study that used a sample of 67.375 analysts' quarterly estimates for companies listed on US stock exchanges.
The study found that the average analysts’ error was 40%, and that the estimates were misleading two-third of the time!
The back test universe and benchmark
Our back test universe is a subset of companies in the Datastream database containing an average of about 1500 companies in the 17 country Eurozone market during our 12-year test period (13 June 1999 to 13 June 2011).
We excluded banks, insurance companies, investment funds, certain holdings companies, and REITS.
We included bankrupt companies to avoid any survivor bias. Bankrupt companies, or companies that were taken over, returns were calculated using the last stock market price available before the company was delisted.
We excluded companies with an average 30-day trading volume of less than €10 000.
It was not a good time to invest in stocks
The test period was most certainly not a good time to be invested in stocks.
The 12-year period we tested included a stock market bubble (1999), two recessions (2001, 2008-2009) and two bear markets (2001-2003, 2007-2009).
To implement your own PB Piotroski F-Score investment strategy - Click here
Holding periods and quintile tests
Each year all the portfolios were formed on 16 June. We chose 16 June as most European companies have a December year-end and by this date all their previous year-end results would be available in the database.
The annual returns for our back test portfolios were calculated as the 12-month price change plus dividends received over the period. Returns were compounded on an annual basis.
This means each year the return of the portfolio (dividends included) would be reinvested (equally weighted) in the strategy the following year.
The portfolios were all constructed on an equal-weighted basis.
In order to test the effectiveness of a strategy, we divided our back test universe into five equal groups (quintiles), according to the factor we were testing. For example, when testing a low price-to-book (PB) value strategy, we ranked our back test universe from the cheapest (lowest PB) to the most expensive (highest PB) stocks.
The cheapest 20% of companies were put in the first quintile (Q1), the next in the second, and so on, with the 20 % of companies with the highest price-to-book value in the fifth quintile (Q5).
Improve your price to book strategy returns
One of the ways you can improve your returns if you use a low Price to Book strategy is to combine it with the Piotroski F-Score.
What is the Piotroski F-Score
The Piotroski F-Score was developed by Joseph D. Piotroski an unknown accounting professor who shuns publicity and rarely gives interviews.
He graduated from the University of Illinois with a B.S. in accounting in 1989 and received an M.B.A. from Indiana University in 1994. Five years later, in 1999, after earning a Ph.D. in accounting from the University of Michigan, he became an associate professor of accounting at the University of Chicago.
In 2000, he wrote a research paper called "Value Investing: The Use of Historical Financial Statement Information to Separate Winners from Losers".
He wanted to see if he can develop a system (using a simple nine-point scoring system) that can increase the returns of a strategy of investing in low price to book (referred to in the paper as high book to market) value companies.
What he found was something that exceeded his most optimistic expectations.
Buying only those companies that scored highest (8 or 9) on his nine-point scale, or F-Score as he called it, over the 20 year period from 1976 to 1996 led to an average out-performance of the market of 13.4%.
Even more impressive were the results of a strategy of investing in the highest F-Score companies (8 or 9) and shorting companies with the lowest F-Score (0 or 1).
7% better than the index over 20 years
Over the same period from 1976 to 1996 (20 years) this strategy led to an average yearly return of 23%, substantially outperforming the average S&P 500 index return of 15.83% over the same period.
This average out-performance of the index of just over 7% may not seem like much but over the 20 year period an investment of 100 in this long short investment strategy would have grown to 6,282 compared to an amount of only 1,860 if you invested in the S&P 500 index.
The difference between these two rates of return over the 20 year period is over 44 times your initial investment!
Piotroski F-Score stand alone strategy
This is what we found when we tested the Piotroski F-Score in Europe over the 12 year period 13 June 1999 to 13 June 2011.
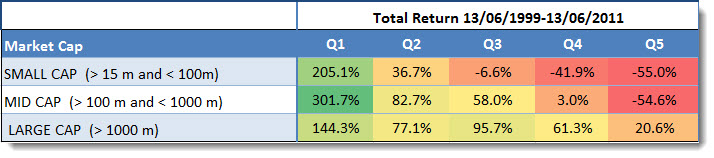
Click image to enlarge
Source: Quantitative Value Investing in Europe: What works for achieving alpha
Q1 (Quintile 1) represents the companies with the highest (best) Piotroski F-Score and Q5 (quintile 5) companies with the lowest Piotroski F-Score (worst).
The highest F-Score companies (Q1) substantially outperformed the market, which over the same 12 year period returned 30.54%.
As you can see the strategy worked best for medium sized companies.
To implement your own PB Piotroski F-Score investment strategy - Click here
Testing the Piotroski F-Score
We also tested the Price to Book ratio with a lot of other ratios (including the Piotroski F-Score) and as you can see in the table below the returns of using only a low Price to Book ratio strategy can be improved substantially.
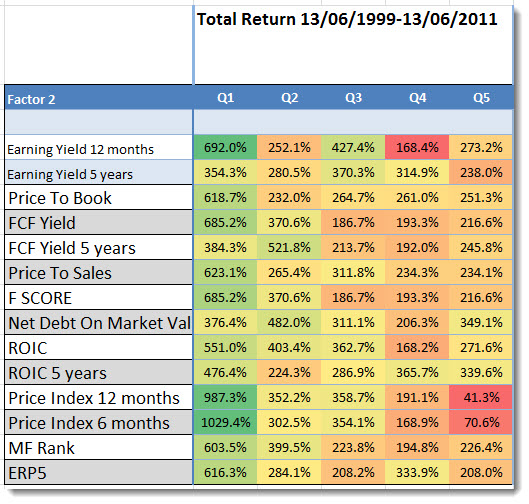
Click image to enlarge
Source: Quantitative Value Investing in Europe: What works for achieving alpha
Best combination – Momentum
As you can see the best way to increase your returns was to combine PB with Price Index 6 months (6 months momentum) or Price Index 12 months (12 months momentum).
Price to book Piotroski F-Score in 4th position
Combining low Price to Book ratio companies with companies that also have the highest (best) Piotroski F-Score would have given you the fourth highest return over the 12 year period of +685.2%, still a very respectable return.
Exact definition – in glossary
You can see the exact definition of all the ratios and indicators in the Glossary
Be careful! – Long periods of under-performance
Although the Price to Book ratio is a good valuation ratio it also has long periods of under-performance, please refer to the following article: Be careful of this time tested value ratio
Use Book to Market rather than Price to Book
When looking for low Price to Book companies it is better if you use the Book to Market ratio (the inverse of Price to Book) to see why read the following article: Why use book to market and not price to book?
Another interesting article
Here is another interesting article on the Piotroski F-Score: Can the Piotroski F-Score also improve your investment strategy?
PS To implement a low Price to Book and Piotroski F-Score investment strategy in your portfolio sign up here.
PPS It is so easy to put things off why not sign up right now before you forget.
To implement your own PB Piotroski F-Score investment strategy - Click here