Looking for a simple yet powerful way to find undervalued US stocks? This article shows you how Free Cash Flow Yield (FCF Yield) can help.
You’ll learn how this "clean" ratio reveals companies that generate real cash—something management can’t fake. Backed by a 40-year back test study, FCF Yield delivered a solid 16.6% annual return.
You’ll discover how to use it step-by-step, avoid common mistakes, and pick only high-quality companies. Best of all, you’ll see how our screener makes finding these stocks effortless. Read on to increase your returns with this proven strategy.
Estimated Reading Time: 4 minutes
Looking for a proven way to find undervalued US companies? Free Cash Flow Yield (FCF Yield) may be exactly what you need.
What Makes FCF Yield Special?
FCF Yield is special because it's "clean" - meaning it's hard for management to manipulate. After all, cash in the bank at the start of the year, plus or minus what the business made or lost, must equal the cash at year-end.
Unless there's outright fraud, the numbers don't lie.
How FCF Yield is Calculated
Here's the simple two-step calculation:
1. Free Cash Flow = Cash from Operations - Capital Expenditure
2. FCF Yield = Free Cash Flow / Enterprise Value
Enterprise Value is the company's:
- Market value
- Plus long-term debt
- Plus minority interest
- Plus preferred capital
- Minus excess cash
Does FCF Yield Really Work?
A 40-year back test study tested FCF Yield against other ratios from 1971 to 2010.
The results were impressive:
- FCF Yield returned 16.6% per year
- It was the second-best performing ratio tested
- Only EBITDA to EV did slightly better at 17.7%
Source: Analyzing Valuation Measures: A Performance Horse-Race over the past 40 Years.
Click here to start finding your own high FCF Yield ideas NOW!
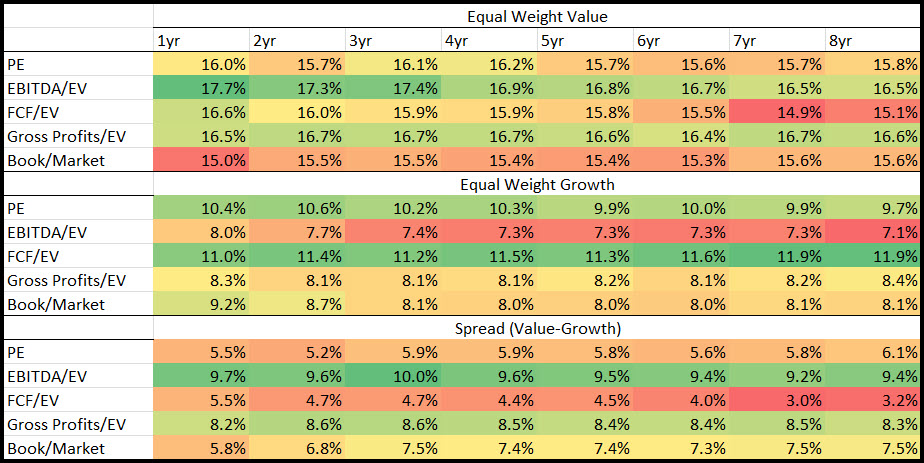
What they found
As you can see (look at the dark green areas of the table) in the 1yr column.
The best valuation ratio they found was trailing 12 month EBITDA to EV with an average return of 17.7% over the 40 year test period.
What about free cash flow yield? Second best ratio
As you can see free cash flow yield was the second best ratio they tested, at 16.6% it was 1.1% per year lower than EBITDA/EV.
Still a very respectable return.
Why Use Only the Last 12 Months?
The research found something surprising - using just the last 12 months of data works better than using:
- 2-year averages
- 5-year averages
- 8-year averages
This makes FCF Yield even easier to use - you only need the latest numbers.
How to Use FCF Yield to Find Great Stocks
Follow these steps:
1. Look for top 20% of companies with the highest FCF Yield
2. Use only trailing 12-month cash flow data
3. Check that debt isn't too high (screen for Debt to Equity of below 35%)
4. Make sure cash flow isn't jumping around (look at the FCF Score which combines Free cash flow growth with free cash flow stability)
Common FCF Yield Mistakes to Avoid
Watch out for:
1. Companies with falling sales (Use 1yr Growth Sales or 5yr Growth Sales)
2. Rising debt levels (Use 1yr Growth Total Debt or 5yr Growth Total Debt)
Put FCF Yield to Work Today
Finding high FCF Yield stocks used to be hard work. Not any more.
Our stock screener finds US companies with high FCF Yield in seconds. It automatically uses trailing 12-month data to give you the best results.
Try it free for 30 days. Sign up for our free demo here.
Click here to start finding your own high FCF Yield ideas NOW!
Next Steps
1. Try our FCF Yield screen - We have already saved a screen for you
2. Get our free newsletter - Sign up for our free “Best Ideas” newsletter
3. Read the complete 40-year back test - Analysing Valuation Measures: A Performance Horse-Race over the past 40 Years.
PS: Markets are uncertain but companies generating real cash rarely disappear. Start using FCF Yield to find them today.
FREQUENTLY ASKED QUESTIONS
1. Why should I trust FCF Yield over other valuation ratios?
FCF Yield is based on real cash, which is hard for companies to manipulate. Unlike earnings, which can be adjusted through accounting choices, cash tells the real story. If a company starts the year with $100 in the bank and ends with $150, that extra $50 is real. Over 40 years, FCF Yield showed a 16.6% average annual return, making it the second-best ratio tested—only slightly behind EBITDA to EV.
2. How do I know if I’m picking the right FCF Yield stocks?
Simple steps:
-
Look for the top 20% of companies with the highest FCF Yield.
-
Use only the latest 12 months’ cash flow data—research shows it works better than multi-year averages.
-
Check debt levels: A Debt-to-Equity ratio below 35% is ideal.
-
Check cash flow stability: Use the FCF Score, which measures both growth and stability. The fewer surprises in cash flow, the better.
3. What mistakes should I avoid when using FCF Yield?
Two big ones:
-
Falling sales: Companies with shrinking sales may struggle no matter how good the FCF looks. Always check 1-year and 5-year sales growth.
-
Rising debt: Avoid companies taking on more debt year after year. Use 1-year and 5-year debt growth as a filter.
4. How does FCF Yield compare to popular metrics like PE ratio?
FCF Yield focuses on real cash generation, not just accounting profits. The PE ratio can be distorted by non-cash items or one-time charges. FCF Yield cuts through the noise. Plus, the back test shows FCF Yield’s 16.6% return over 40 years beats many popular ratios.
5. Why use only the last 12 months of data? Wouldn’t more years give better insights?
Surprisingly, no. The 40-year study found that using just the trailing 12 months gave better returns than 2-year, 5-year, or 8-year averages. This keeps things simple and ensures you’re working with the latest financial reality.
6. What if I don’t have time to run all these checks?
Good news: You don’t have to. The Quant Investing Screener automates all of this in seconds. It filters for high FCF Yield, checks for debt levels, and uses the most recent 12-month data—no manual calculations needed.
7. How does this approach help me beat the market?
Beating the market comes from buying undervalued companies that others overlook. FCF Yield helps you spot cash-generating businesses that are selling cheaply. Companies that generate real cash are resilient, even in tough markets. And with a proven 16.6% annual return track record, this ratio gives you a practical edge.
Click here to start finding your own high FCF Yield ideas NOW!