This is the editorial of our monthly Quant Value Investment Newsletter published on 02.07.2024. Sign up here to get it in your inbox the first Tuesday of every month.
More information about the newsletter can be found here: This is how we select ideas for the Quant Value investment newsletter
This month you can read all about the newsletter’s recent performance and since it started 14 years ago.
But first the portfolio updates.
Portfolio Changes
Europe – Buy One – Sell One
One new recommendation this month as the index is above its 200-day simple moving average.
It is a GBP 236m, debt free UK-based infrastructure consulting company trading at Price to Earnings ratio of 10.6, Price to Free Cash Flow of 4.2, EV to EBIT of 2.2, EV to Free Cash Flow of 1.7, Price to Book of 1.1 and paying a dividend of 1.4%.
Stop Loss
Sell Carlo Gavazzi Holding AG at a profit of +15.4%
North America – Nothing to do
No new recommendation this month as the companies we found elsewhere in the world fit the newsletter’s investment strategy a lot better.
Asia – Buy Four – Hold Two – Sell Four
Four recommendations this month as the index is above its 200-day simple moving average.
The first is a dirt cheap, negative enterprise value (cash is larger than market value + debt), HKD 1.1bn (€130m) Hong Kong-based restaurant operator trading at Price to Earnings ratio of 5.6, Price to Free Cash Flow of 2.3, EV to EBIT of -1.4, EV to Free Cash Flow of -0.4, Price to Book of 0.3 with an 8.6% dividend yield.
The second is a debt free JPY11.8bn (€68m) Japanese information communication equipment provider currently trading at Price to Earnings ratio of 6.0, Price to Free Cash Flow of 2.8, EV to EBIT of 1.2, EV to Free Cash Flow of 0.9, Price to Book of 1.0 with a dividend yield of 2.5%.
The third is a very cheap, debt free HKD 763m (€91m) Hong Kong manufacturer of sleep and loungewear trading at Price to Earnings ratio of 4.3, Price to Free Cash Flow of 2.9, EV to EBIT of 1.4, EV to Free Cash Flow of 1.2, Price to Book of 1.1 and paying a dividend of 8.0%.
The last is a fast growing, debt free JPY60.9bn (€350m) Japanese manufacturer of rear-view mirrors and fine glass currently trading at Price to Earnings ratio of 9.9, Price to Free Cash Flow of 7.0, EV to EBIT of 1.8, EV to Free Cash Flow of 1.8, Price to Book of 0.7 with a dividend yield of 1.4%.
Hold Two
Continue to hold HRnetGroup Limited +0.0% and Kaga Electronics Co., Ltd. -6.0% (both recommended in July 2023) as they still meet the portfolio’s selection criteria.
Sell One
Sell JCU Corporation at a profit of +19.6% as it no longer meets the portfolio’s selection criteria.
Stop Loss
Sell Food Empire Holdings Limited at a profit of +12.2%
Sell Koa Shoji Holdings Co., Ltd. at a small loss of -4.2%
Sell Yamau Holdings Co., Ltd. at a loss of -8.8%
Crash Portfolio – Nothing to do
No new Crash Portfolio ideas as most markets have recovered.
To date the 15 Crash Portfolio ideas, recommended between August 2022 and May 2023, are up an average of 39.3%!
Newsletter’s Performance
Let’s start with the performance of the ideas currently in the portfolios.
|
Current European Investment Ideas |
|
|
Number of companies |
20 |
|
Average return |
29% |
|
Percentage of ideas with a positive return |
75% |
|
|
|
|
Current North American Investment Ideas |
|
|
Number of companies |
9 |
|
Average return |
12% |
|
Percentage of ideas with a positive return |
67% |
|
|
|
|
Current Asia Investment Ideas |
|
|
Number of companies |
35 |
|
Average return |
25% |
|
Percentage of ideas with a positive return |
66% |
|
|
|
|
Current Crash Portfolio 2022 |
|
|
Number of companies |
3 |
|
Average return |
92% |
|
Percentage of ideas with a positive return |
100% |
As you can see performance has been great with Europe, Asia with the Crash Portfolio performing especially well, up +92%!
Let’s now look at the long-term performance as that is the data that is important for you to see if the newsletters’ investment strategy works.
Performance Since July 2010 – 14 years ago
|
Total Investment Ideas: |
585 |
|
|
Includes current and sold ideas |
|
|
|
Return of All Ideas |
|
|
|
Average |
|
22.4% |
|
Median |
|
11.3% |
|
Maximum |
|
317.5% |
|
Minimum |
|
-86.1% |
- Loss of 86.1% occurred before we started the Stop Loss system
- Returns are calculated as price change plus dividends in the currency of the company's main listing.
- Includes returns of Crash portfolios
Yearly Returns
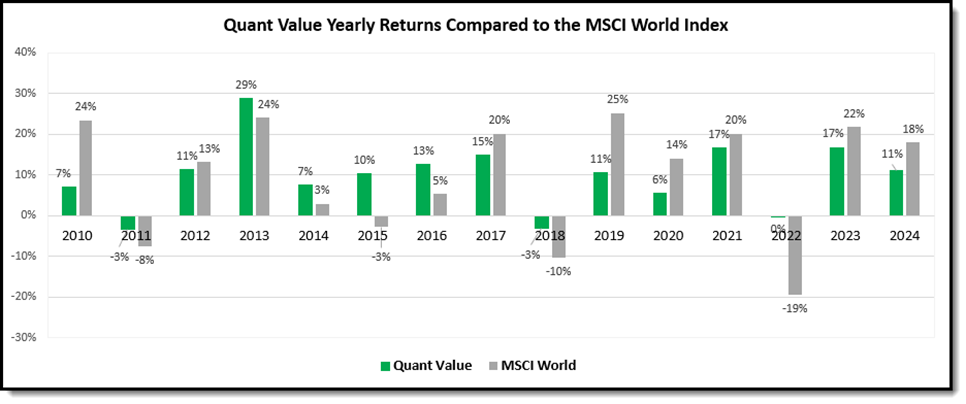
|
Quant Value |
MSCI World |
|
|
Average Return |
9.8% |
9.9% |
|
Std Dev |
8.0% |
13.8% |
|
CAGR |
9.4% |
8.3% |
|
Sharpe Ratio |
1.22 |
0.71 |
Performance of the newsletter compared to the MSCI World stock market index
Std Dev = Standard Deviation of all yearly returns
CAGR = Compound Annual Growth Rate
Sharpe Ratio = Average Return / Std Dev (Risk adjusted return measure)
Even though average returns were about the same the newsletter beat the index on a CAGR basis because it kept losses low. You can clearly see this in all negative years as well as in the lower Standard Deviation of returns and the higher Sharpe Ratio.
Because the newsletter only starts investing when the market is above its 200-day simple moving average it underperformed the market after loss making years.
In 2010 the newsletter underperformed the market as it was only started in July and investments were built up slowly from zero.
Dividend income
Even though we do not look at dividends when choosing ideas, an attractive dividend is a nice bonus as you get paid to wait as stock prices increase.
|
Dividends |
|
|
|
Average |
|
4.4% |
|
Median |
|
2.5% |
|
Maximum |
|
61.0% |
Average divided return of all ideas
Country performance
This is where companies were recommended and how they performed:
|
Country |
% of Ideas |
Return |
|
USA |
18% |
19.3% |
|
France |
12% |
31.0% |
|
Japan |
21% |
19.7% |
|
UK |
11% |
25.6% |
|
Canada |
7% |
15.6% |
|
Italy |
4% |
39.3% |
|
Germany |
4% |
27.1% |
|
Australia |
3% |
6.6% |
|
Belgium |
2% |
5.0% |
|
Switzerland |
2% |
16.6% |
|
Netherlands |
1% |
24.0% |
|
Norway |
2% |
27.3% |
|
Sweden |
2% |
30.1% |
|
Other |
11% |
15.4% |
Where ideas were recommended and average return
How long are idea in the portfolio?
All ideas are analysed again after a one year holding period, to see if they still meet the newsletter’s Quality, Value and Momentum, investment criteria.
As the following table shows, companies mostly stay in the portfolio for a year.
|
Holding Period |
|
|
|
Average |
1 |
year |
|
Median |
1 |
year |
|
Maximum |
4 |
years |
How long are ideas in the portfolio
Distribution of returns
This is the most important chart!
You know investing works best when you cut your losses fast and let your winners run. To do this the newsletter follows a STRICT 20% trailing stop loss system.
The following two charts show you how successful the newsletter has been at doing this.
Over 13 years 63% (just under two third of all ideas) would have given you a positive return, with the highest return of 315.5% (the second highest was +269.2%).
Chart showing number of companies:
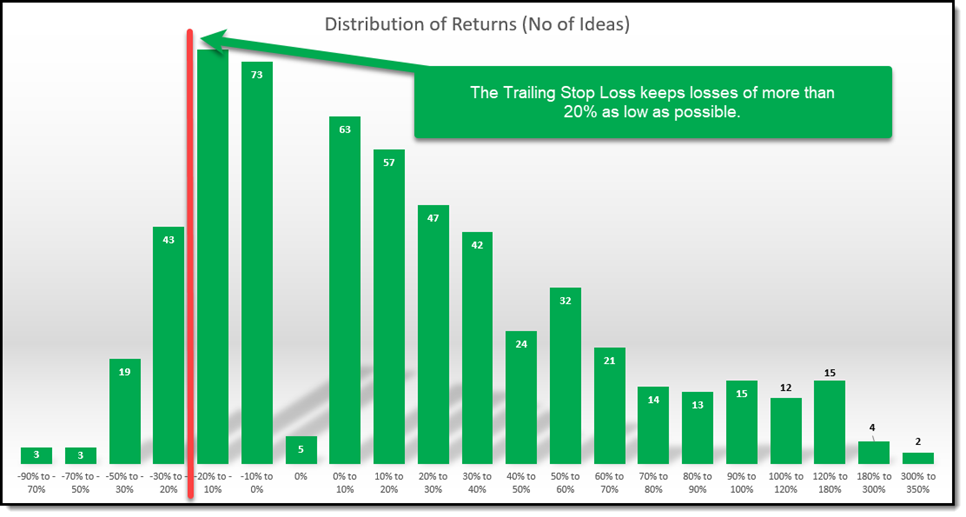
Distribution of newsletter returns – Showing number of companies
Chart Showing percent of all recommended companies:
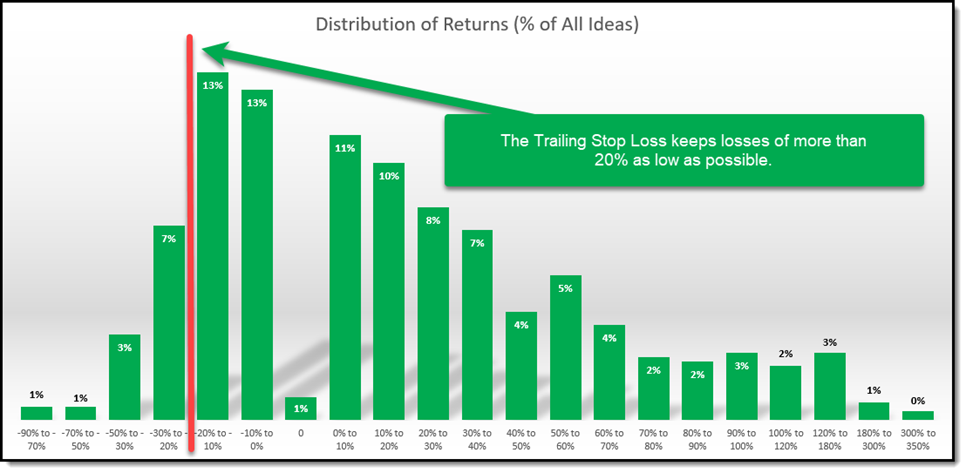
Distribution of newsletter returns – Percent of all ideas
Over 3.5 to 1 more winners than losers
|
Ideas with a return of: |
Number |
% of All Ideas |
|
More than 20% |
241 |
41% |
|
More than 50% |
128 |
22% |
|
More than 100% |
33 |
6% |
|
More than 300% |
2 |
0.3% |
3.5 times more winners over 20% than losers
As you can see the positive returns FAR outnumber negative returns.
For example, returns of more than 20% is 3.5 (241/68) times higher than losses of more than 20%.
This is because of three things:
- A great time-tested investment strategy
- The strict stop loss system
- Stop buying when markets fall
The stop-loss system works!
You already saw how well the stop loss system works.
It works so well that since March 2015, when we implemented it, only 11 of the 585 (1.9%) ideas lost more than 40%.
This happened because of large sudden price drops, (before the stop-loss system can sell) for example, after a profit warning, legal action, stock suspension or fraud announcement.
The stop loss system lets you avoid the left-hand side of returns (losses in the chart above).
This is important because:
- You feel more comfortable investing, even in companies you may not know. It is easier to get in if you know you can get out.
- You avoid the emotional pain of a large losses. This helps you stick to the investment strategy.
Not a subscriber? Click here to get ideas from the BEST strategies we have tested NOW!