
In this post, you'll discover a better momentum indicator called Exponential Regression also called Adjusted Slope.
If you've struggled with finding stocks that are truly on the move up, this guide will show you how to identify the best opportunities with greater accuracy - stocks going up smoothly without sudden huge jumps!
You'll learn why Exponential Regression outshines traditional momentum indicators and how to easily apply it to your own investments. By the end, you'll have a clear, actionable strategy to enhance your portfolio’s growth.
Estimated Reading time: 6 minutes
Has a friend ever forced you to read a book? It happened to me and I was glad he did because it showed me a better momentum indicator (exponential regression) that we immediately added to the Quant Investing stock screener. The book he forced me to read was Stocks on the Move: Beating the Market with Hedge Fund Momentum Strategies by Andreas Clenow.
It is a great book that is easy and fun to read in spite of its intimidating title. Add it to your reading list you will definitely learn something.
More information about Andreas and exponential regression
You can read more about Andreas and exponential momentum here: More insights from Andreas Clenow author of Stocks on the Move: Beating the Market with Hedge Fund Momentum Strategies
We did our own backtest with the adjusted slope indicator on stocks world-wide in this article: This easy to use adjusted slope momentum strategy performed 7 times better than the market
A great trading strategy using "better" momentum
The book describes a very profitable trading strategy that uses a different way of calculating stock price momentum, to help you find stocks that are moving up (stocks on the move).
Problem with existing momentum calculations
If you are looking for stocks that are moving up nice and smoothly there is a problem with the way momentum is normally calculated.
For example 6 months momentum is calculated as the current share price divided by the share price six months ago.
The following chart shows the problem with this calculation:
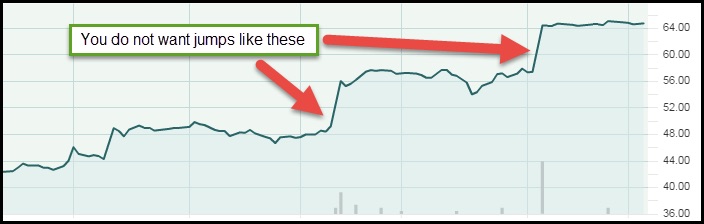
You do not want jumps like this when using momentum
When looking for a stock with good momentum you want to find one that is moving up smoothly, you do not want to see large jumps in the share price, for example because of a takeover offer or better than expected results.
A stock price that makes large jumps may not move up much more because the news is already priced in.
This is not nearly as profitable as a smoothly upward moving stock price due to every day interest by investors willing to buy the stock at a slightly higher price.
Click here to start finding your own exponential regression ideas NOW!
The Better Momentum Calculation
To find stocks with a smoothly upward moving stock price you want to calculate the average daily percent increase in the stock price. To do this Andreas uses exponential regression.
For example, using exponential regression, you can calculate that over a 90 day period a stock price increased by 0.05% per day. Then, if you assume there are 260 trading days in a year, theoretically the share price may go up 13.88% (0.05% to the power 260) over a year.
Keep in mind that you do not expect to make this return but it gives you an idea of how much the stock price can increase over a year if you assume the increase over the past 90 days continues.
All Calculations Done for You
Do not worry if the calculations look intimidating, you do not need to know any of it to use this better momentum indicator to find investment ideas.
All the calculations are done for you in the Quant Investing stock screener.
How Well Does It Fit - Adjusted Slope using R2
To get rid of companies with a large jump in share price (bad momentum) you want to make sure that the calculated daily price increase is as close as possible to the real daily increase in the stock price.
Luckily there is a value that allows us to do exactly that.
It is called R2 (the coefficient of determination) and it tells you how well the calculated daily stock price increase fits the real daily increase.
If R2 is equal to 1 the real daily increase is exactly equal to the calculated value and if it is close to zero the calculated value is not at all close to the real daily increase.
To see how well the daily stock price increase fits the actual share price movements is easy to calculate.
Simply multiply the calculated increase (exponential regression) by the R2 value. If the fit is good (close to 1) the calculated value will remain the same but if it is bad (R2 less than 1) the calculated share price increase will decrease.
In the screener we call the indicator (exponential regression x R2) the Adjusted Slope of the stock price.
Adjusted Slope in the screener
The screener has two adjusted slope indicators you can use:
Adjusted Slope 90d
The Adjusted Slope 90d is equal to the annualised exponential regression slope multiplied by the coefficient of determination (R2) over the past 90 trading days.
What is means in easy to understand English
In easy to understand English, the Adjusted Slope 90d shows you how much the share price of a stock could increase over a year if you assume the increase over the past 90 trading days continues for the remainder of the year. AND this value is adjusted for how well the calculated increase matches the real increase in the stock price, as explained above.
Where can you find it in the screener?
In the screener you can use the Adjusted Slope 90d indicator either as a primary factor or as a column in the results of your screen.
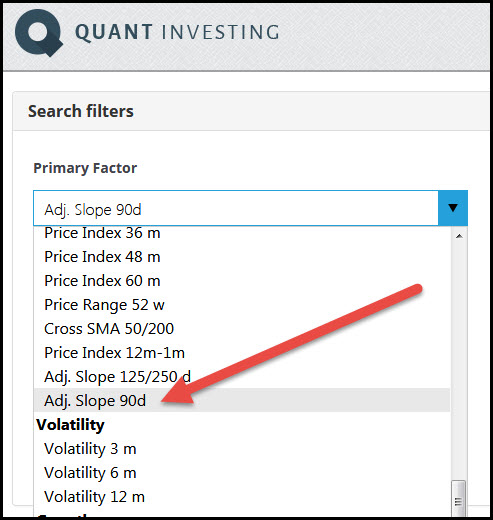
How to select Adjusted Slope 90d as a primary screening factor
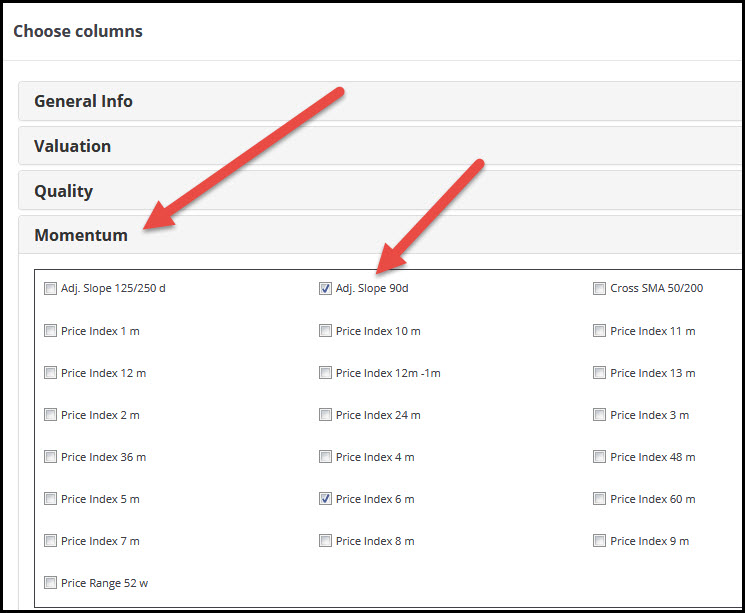
How to select Adjusted Slope 90d as an output column
Click here to start getting exponential regression ideas NOW!
What is good and bad momentum?
The higher the Adjusted Slope 90d value the better as it means the share price has increased a lot over the past 90 trading days and that the calculated increase in the stock price closely fits the real increase in the stock price.
You can select the best Adjusted Slope 90d value companies by setting the slider from 0% to 10% or by sorting the output column from high to low (to sort the column click on the column heading).
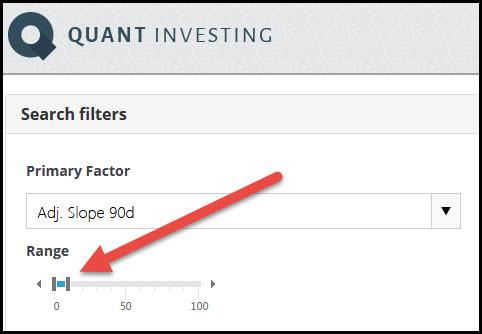
How to select best Adjusted Slope 90d values
Adjusted Slope 125/250d
Adjusted Slope 125/250d is equal to the average annualised exponential regression slope, over the past 125 and 250 trading days, multiplied by the coefficient of determination (R2).
It is thus the average of the 125 day and 250 day adjusted slope values.
Why an average of 125 and 250 days?
Why calculate the average you may be thinking. This is to give you a longer term (6 months and one year) average adjusted slope value that smooths out large movements in stock prices (by using the average).
You can use this indicator to find stocks that have been on a smooth upward trend over the past six months as well as the past year.
What is means in easy to understand English
In easy to understand English, the Adjusted Slope 125/250d shows you how much the share price of a stock has increased over the past year if you average the 125d and 250d adjusted slope values. AND this value is adjusted for how well the calculated increase matches the real increase in the stock price, as explained above.
Where can you find it?
In the screener you can use the Adjusted Slope 125/250d indicator either as a primary factor or as a column in the results of your screen.
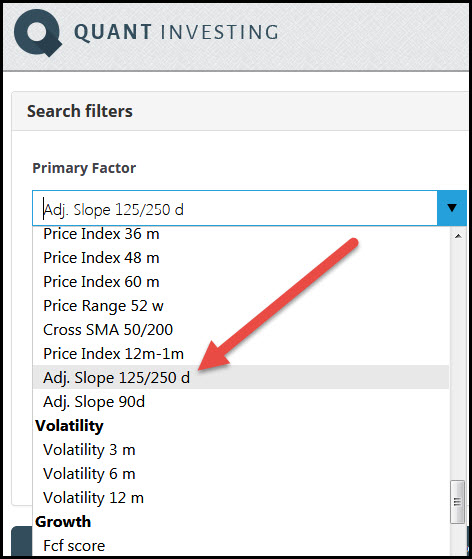
How to select Adjusted Slope 125/250d as a primary screening factor
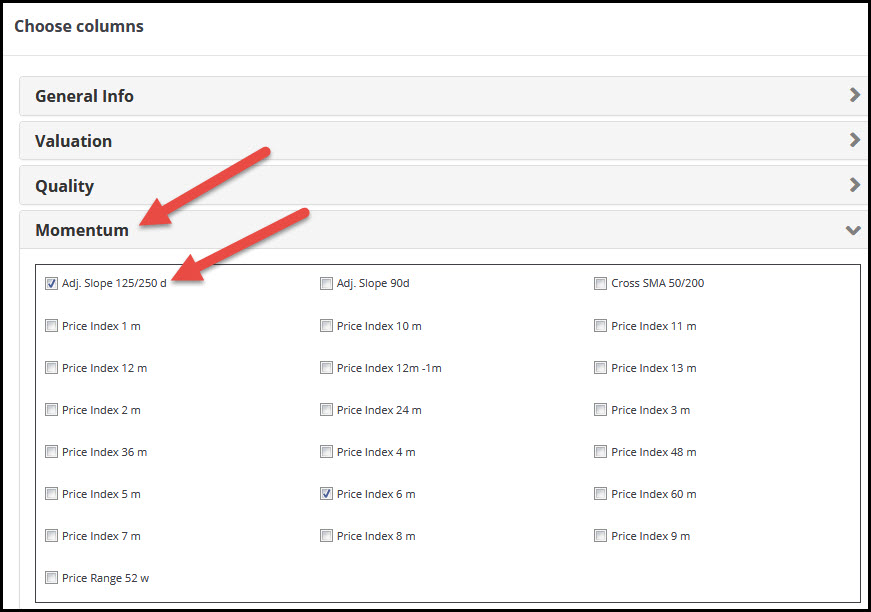
How to select Adjusted Slope 125/250d as an output column
Higher Adjusted Slope value is better
The higher the Adjusted Slope 125/250d value the better. It means the share price has increased a lot over an average of the past 125 and 205 trading days and that the calculated increase closely fits the real increase in the stock price.
You can select the best Adjusted Slope 125/250d values by setting the slider from 0% to 10% or by sorting the output column from high to low (to sort the column click on the column heading).
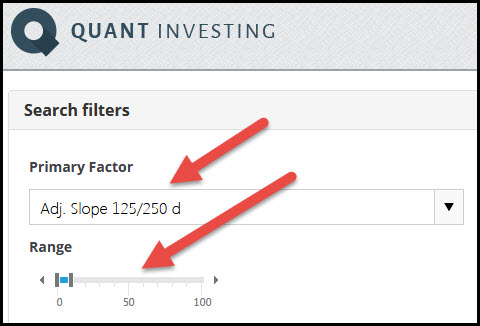
How to select best Adjusted Slope 125/250d values
Summary and Conclusion
In summary the adjusted slope is a better momentum indicator you can use to find companies with a stock price that is moving up smoothly. It does this by removing companies with a stock price that has moved up in big jumps.
I am sure it is an indicator that will help you find even more profitable investment ideas as it is available on all the, more than 22,000 companies, in the screener.
Click here to start finding your own exponential regression ideas NOW!
Frequently Asked Questions
1. What is exponential regression in stock investing?
Exponential regression is a method to calculate how smoothly a stock's price increases over time. It helps you spot stocks with consistent upward momentum.
2. Why is exponential regression better than traditional momentum indicators?
Traditional momentum measures can be skewed by sudden price jumps. Exponential regression smooths these out, giving a clearer picture of a stock's true upward trend.
3. How can I use the Adjusted Slope 90d in my investment strategy?
The Adjusted Slope 90d helps you estimate how much a stock might grow over a year based on its recent 90-day performance, adjusted for accuracy.
4. Is exponential regression complicated to use?
The calculations are complex, but tools like the Quant Investing screener handles it all, making it easy for you to use.
5. How does the R² value affect the momentum indicator?
The R² value shows how closely the calculated momentum matches the actual price movements. A higher R² means a closer match and a smoother upward stock price movement.
6. Can exponential regression predict future stock prices?
While it can’t predict exact prices, it helps estimate potential growth based on past trends, giving you an edge in spotting promising stocks with good momentum.
7. Why should I care about the Adjusted Slope 125/250d?
The Adjusted Slope 125/250d gives a longer-term view, averaging momentum over 6 months and a year, helping you find stable, long-term growth stocks.
8. How do I find the best stocks using this indicator?
Use the Adjusted Slope indicators in a stock screener, and focus on those with higher values, indicating smoother, consistent growth.
9. What’s the main advantage of using exponential regression?
It filters out stocks with erratic price jumps, letting you focus on those with steady, predictable growth, making your investments decisions more reliable.
10. Can I use this strategy without a lot of technical knowledge?
Yes, tools like the Quant Investing screener do the heavy lifting, so you can easily benefit from this advanced momentum strategy without deep technical expertise.
PS To get unlimited access to the adjusted slope as well as over 110 other ratios and indicators you can use to find investment ideas sign up for the screener, it costs less than an inexpensive lunch for two.
PPS Why not sign up right now (before you get distracted)? Simply click the following link: Screener sign up today
Click here to start finding your own exponential regression ideas NOW!
More information about Andreas and exponential regression
You can read more about the author Andreas and exponential momentum in this interview:
We did our own back test with the adjusted slope indicator on stocks world-wide in this article:
This easy to use adjusted slope momentum strategy performed 7 times better than the market