
Estimated Reading Time: 7 minutes
Learn how the adjusted slope momentum strategy can dramatically increase your investment returns. This strategy, tested over 15 years, delivered a 363% return—nearly seven times better than the market.
You'll discover how to select stocks with strong upward trends, use volatility-adjusted indicators, and manage your portfolio to limit losses. The article provides clear steps to implement this powerful strategy using our stock screener.
In an earlier article I told you about the better momentum indicator, adjusted slope, we read about in Andreas Clenow’s great book Stocks on the Move: Beating the Market with Hedge Fund Momentum Strategies
You can read more about Andreas Clenow here:
How to find stocks on the move with a better momentum indicator - exponential regression
We also wanted to test Adjusted Slope
As with all good research we wanted to do our own test of the strategy to see if it works in other markets, mainly outside the USA.
Well we completed the back test, the results were great, and that is what this blog post is all about.
Adjusted slope works
Just Andreas Clenow found when he tested the adjusted slope momentum investment strategy on the US market we found it works on companies worldwide.
Before I show you exactly how well it worked first some information on what and how we tested.
What companies were included?
We used the Market Leader companies universe worldwide but excluded companies registered in Singapore, Hong Kong, Japan and Malaysia.
This gave us an investment universe of around 360 large companies mainly in Europe (incl. Scandinavia and the UK) and the USA.
Just to refresh your mind Market Leading companies are large companies on steroids.
They are non-utility companies extracted from the screener database of more than 22,000 companies with larger than average:
- Market value
- Number of shares outstanding
- Free Cash flow and
- Sales above 1.5 times the average of the universe
How we selected investments
To select investment ideas for the back test portfolio we used a share price momentum indicator called Adjusted Slope 125/250d.
Each month all the companies in the universe were ranked from high to low using Adjusted Slope 125/250d – in other words companies with the best smooth upward moving share price momentum over 125 and 250 days.
Only companies with an Adjusted Slope 125/250d value higher than 38 were included in the portfolio.
If no company had a value of more than 38 – in other words they had weak momentum - the back test portfolio remained in cash until the following month.
What is Adjusted Slope 125/250d?
The Adjusted Slope 125/250d is a momentum indicator calculated as the average annualized exponential regression slope, of a company’s share price, over the past 125 and 250 trading days, multiplied by the coefficient of determination (R2).
It is thus the average of the 125 day and 250 day adjusted slope values.
Why an average of 125 and 250 days?
Why calculate the average you may be thinking. This is to give you a longer term (6 months and one year) average adjusted slope value that smooths out large movements in stock prices (by using the average).
You can thus use this indicator to find stocks that have been on a smooth upward trend over the past six months as well as the past year.
What it means in easy to understand English
In easy to understand English, the Adjusted Slope 125/250d shows you how much the price of a stock has increased over the past year if you average the 125d and 250d adjusted slope values. AND this value is adjusted for how well the calculated increase matches the real increase in the stock price.
It is thus a momentum indicator that is adjusted for volatility. The lower the volatility of the company’s share price the higher (higher is better) the adjusted slope value of the company will be.
Click here to start using Adjusted Slope in your portfolio NOW!
Position sizing
Positions in the back test portfolio were sized using the Target Weight indicator in the screener.
No company was allowed to have a portfolio weight of more than 2.2%. This was done to make sure that no one company can overly influence the results of the back test.
What is Target Weight?
Target Weight is the volatility adjusted recommended position size for a stock in your portfolio. It gives you an idea of what the percentage weighting of the stock should be in your portfolio when you buy it.
Target Weight looks at the past 100 day volatility of the stock and calculates the target weight accordingly. The more volatile a stock is the lower the target weight will be.
Back test period - just over 15 years
We tested the investment strategy over just more than 15 years from 4 January 2002 to 12 May 2017.
When and how portfolios were formed - Monthly
Portfolios were formed on a monthly basis and were re-balanced monthly.
Only companies with an Adjusted Slope 125/250d value of greater than 38 were included in the portfolio. If no company had a value of more than 38 – in other words they had weak momentum - the back test portfolio remained in cash until the following month.
A company was sold if on the re-balancing day it had an Adjusted Slope 125/250d value of less than 33. A value of less than 33 means the share price momentum of the company declined.
Positions in the back test portfolio were sized using the Target Weight indicator in the screener. No company was allowed to have a weight of more than 2.2% of the portfolio. This was done to make sure that no one company can overly influence the results of the back test.
How we avoided biases
Look-ahead bias
Look-ahead bias happens when the data the back test is based on information that could not have been known or available during the back test period.
For example, if you formed portfolios on 31 December each year using the company’s 31 December financial information. This is not possible because the company’s 31 December financial information is only released three to five months after 31 December.
Because the Adjusted Slope indicator only uses stock price data there is no risk that the back test had a look-ahead bias. Price data is available to everyone every day.
Only companies with a historical share price data of at least 250 days were included in the back test universe. If not the Adjusted Slope 125/250d indicator could not be calculated.
To calculate the market leader universe financial data at least six months old was used. This means that financial results six months ago were used to put together the investment universe the day the back test portfolios were formed.
This removed look-ahead bias completely as six months is much longer lag time compared to other back tests which mainly use three months.
Survivorship bias
Survivorship bias can lead to better back test returns because companies that went bankrupt were ignored (not in the back test universe) when the back test portfolios were formed.
In spite of what all researchers say it is very hard to exclude survivor ship bias. Here each researcher has to rely on the data supplier. The data we used in the back test came from one of the big three data supplier. So we have a lot of confidence in the data quality used in this back test.
Also, because we use the world wide large company market leader investment universe with bigger than average:
- Market value
- Number of shares outstanding
- Free Cash flow and
- Sales above 1.5 times the average of the universe
This lowered survivorship bias a lot because healthy growing large companies do not go bankrupt as often as small junk companies do. This means even if some of these companies did go bankrupt it is very likely that they were included in the back test universe.
For example, the smallest company in the universe had a market value of €1.5 billion.
Also when a company goes bankrupt its share price falls, this means it would have been sold at the monthly re-balance. And even it if did go bankrupt within a month it would have been sold at the price (in this case zero) at the monthly re-balance.
Overfitting bias
Overfitting bias can take place if the back test is done using ONLY a period when the investment strategy worked very well. This means if you use the strategy in another period it will not work as well at all.
We did not select a specific period to test the strategy we used ALL the historical data we had which means we tested the investment strategy over just more than 15 years from 4 January 2002 to 12 May 2017.
This 15-year period included the tail end of the bursting of the internet stock market bubble (2002), two recessions (2001, 2008-2009) and two bear markets (2001-2003, 2007-2009) including the financial crisis.
The strategy will of course perform differently over another period – but this is true of all strategies.
Overfitting bias can also occur if you choose the values of ratios or indicators to buy and sell that only worked in the tested time period.
In this back test we added a company to the portfolio if its Adjusted Slope 125/250d value was greater than 38 and sold it a month later if the same value was less than 33.
This is important
We tested several Adjusted Slope numbers to buy and sell, for example buy above 40 and sell below 25 and the results were all more or less the same.
Trading costs included
We included 0.15% trading costs on every transaction.
As the market leaders universe is made up only of large companies – smallest company had a market value of €1.5n - we assume that bid ask spreads did not influence the results by much.
Click here to start using Adjusted Slope in your portfolio NOW!
Does the strategy work?
Now for the most important part, did the strategy work?
Yes it did!
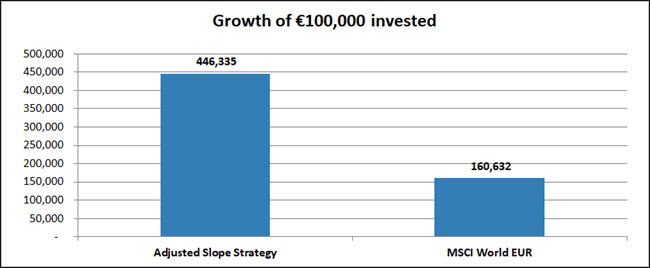
This following chart shows the growth of €100,000 invested using this strategy compared to the MSCI World Index performance in Euro.
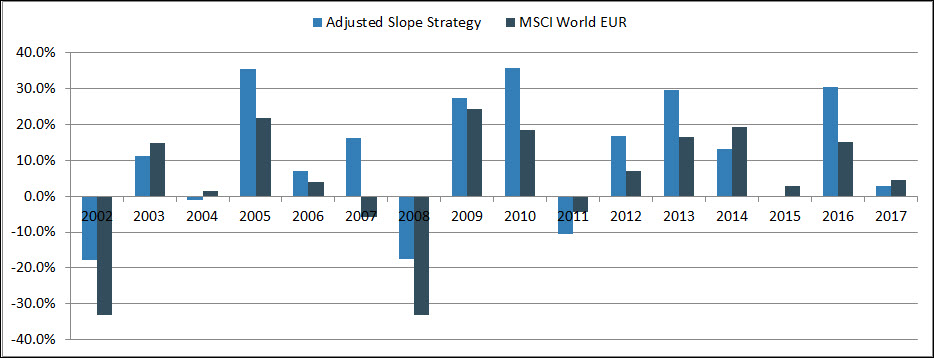
And this is what the yearly performance of the strategy looked like.
Click image to enlarge

Click image to enlarge
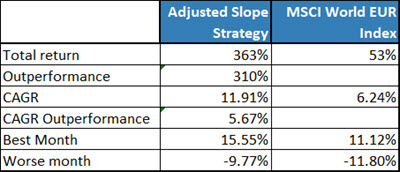
As you can see the momentum based strategy lowered losses substantially and out-performed the market in good years.
What is not to like about that!
Summary and conclusion
If you used the adjusted slope strategy in your portfolio you would have earned a total of 363% over the 15 year test period.
This is nearly seven times the performance of the market which was up 53% over the same period. So it’s definitely a solid strategy for you to consider adding to how you choose investment ideas.
Click here to start using Adjusted Slope in your portfolio NOW!
How to implement the Adjusted Slope investment strategy in your portfolio
The great thing about this investment strategy is that:
- It is easy to implement
- Gives great returns
- Limits losses
This is how you can implement the strategy in your portfolio.
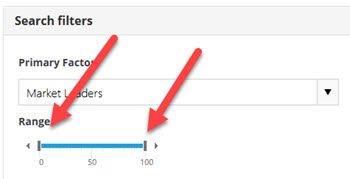
The first thing you need to do is select the Market Leader universe.
To do click on the drop down arrow in the box below Primary Factor, scroll right down to the bottom and click on Market Leaders.
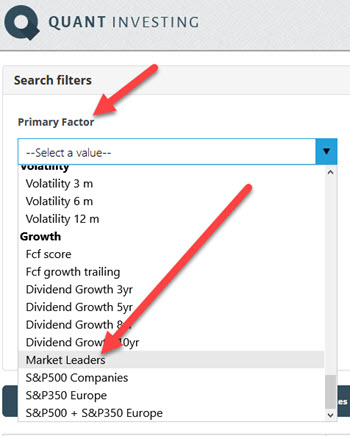
Move the slider from 0% to 100% to select all companies in the Market Leader universe.
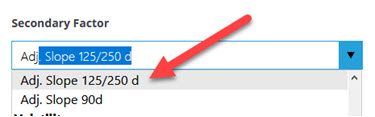
As a Secondary Factor select Adj. Slope 125/250d, you can find it easily by typing “adj” in the box as shown below.
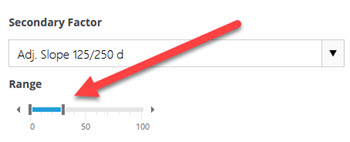
Set the slider from 0% to 30% so you select 30% of companies with the best Adjusted Slope momentum.
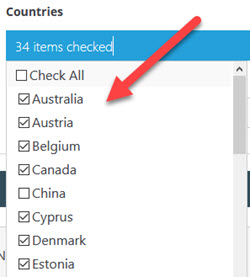
Then select all the countries you invest in.
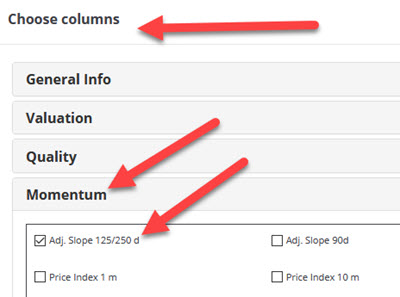
Click on the Choose columns button to select Adj. Slope 125/250d as one of the output columns of your screen. You can find it by clicking on the Momentum heading.
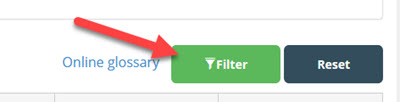
Then click on the Filter button to run your screen.
The last thing you want to do is sort the Adj. Slope 125/250d values from high (best) to low. To do this click on the Adj. Slope 125/250d column heading twice.
The first time you click it will be sorted from low to high and the second time from high to low.
Remember only companies with an Adjusted Slope 125/250d value of greater than 38 were included in the portfolio. If no company had a value of more than 38 – in other words they had weak momentum - the back test portfolio held cash until the following month.
A company was sold if on the re-balancing day it had an Adjusted Slope 125/250d value of less than 33. A value of less than 33 means the share price momentum of the company declined.
Save your screen
You can save this screen so in future you can call it up with a few mouse clicks.
To do this click on the My templates button then click the Save to template menu item.

That is all you have to do implement your momentum investment strategy using the adjusted slope indicator.
PS If you are not a screener subscriber yet click here to sign up now, it costs less than an inexpensive lunch for two and gives you over 22,000 companies to screen using over 110 ratios and indicators.
PPS It is so easy to put things off why not sign up right now to get this investment strategy working in your portfolio?
Click here to start using Adjusted Slope in your portfolio NOW!
Frequently Asked Questions
1. What is the Adjusted Slope Momentum Strategy?
It's a method to identify stocks with a strong upward trend by averaging their momentum over 125 and 250 days, adjusted for volatility.
2. How can this strategy help me beat the market?
It has shown to outperform the market significantly, delivering a 363% return over 15 years, compared to 53% for the market.
3. Is this strategy easy to implement in my portfolio?
Yes, it’s straightforward and involves selecting stocks with high adjusted slope values using a stock screener.
4. Why use the 125/250-day average?
This average smooths out price fluctuations, identifying stocks with consistent upward trends over six months to a year.
5. How do I decide when to buy or sell a stock?
Buy when the adjusted slope value is over 38 and sell if it drops below 33 when you rebalance your portfolio. This lets you buy high momentum stocks and sell them when their momentum slows down.
6. Does this strategy work worldwide?
Yes, it has been tested and proven effective on a global scale, excluding a few specific markets.
7. What is the Target Weight, and how should I use it?
It’s a volatility-adjusted position size recommendation, ensuring no stock dominates your portfolio.
8. How do I handle a market with weak momentum?
If no stocks meet the required momentum threshold, the strategy suggests holding cash until better opportunities arise.
9. Can this strategy avoid common biases in back testing?
Yes, it avoids look-ahead, survivorship, and overfitting biases by using historical price data and testing over various market conditions.
10. How often should I rebalance my portfolio?
Rebalance monthly to ensure your portfolio includes only the top momentum stocks and to adjust for any changes in stock price momentum.
Click here to start using Adjusted Slope in your portfolio NOW!