We just launched a substantially improved version of the Quant Investing stock screener.
This is what is new
This is what has been improved:
- Company snapshot added
- Description
- General information
- Valuation ratios
- Quality ratios
- Momentum ratios
- Growth ratios
- Company compared to all in your screen
- Share price chart
- More Industry sectors added
- Screener results can be grouped by any ratio or indicator, for example by
- Country
- Industry
- F-Score
- Screener and the output (columns displayed) can be selected and saved separately
We improve all the time
You know that we improve on the screener all the time based on good research we read and back tests we do.
Remember we use it daily to invest our own money so we have the same goal as you have – solid investment returns using time tested investment strategies.
It is a screener build by investors for investors.
When we wanted to make an improvement recently we found out that the existing software we used could not do it.
We found a better alternative
Luckily we found a better alternative that allowed us to add a lot of improvements we have been planning for a long time.
We finished testing and it’s available - please take it for a test drive!
Where to find it
To start the new screener log in.
On the next page click the Go to new Screener button.
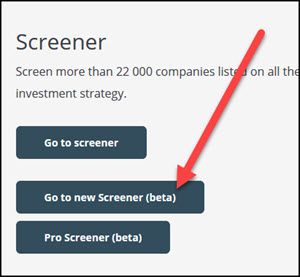
On the next page you will see it looks similar to the old screener but there are important differences.
Company snapshot – quick company research
The most asked for improvement was to see a detailed company description.
To find the information simply click on the company name.
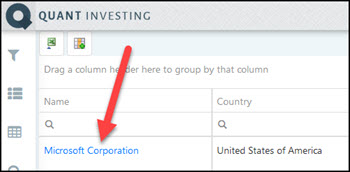
On the next page you will see a complete summary of what the company is all about.
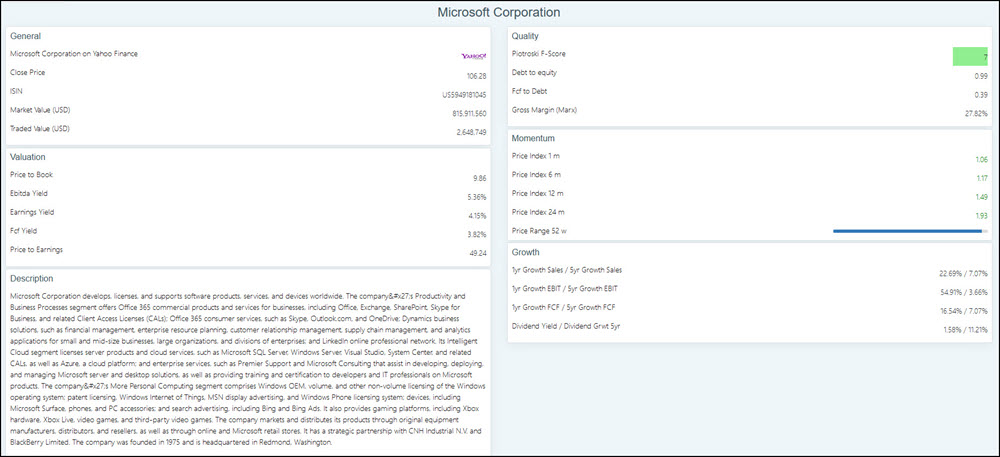
Click image to enlarge
Let’s look at the page more closely.
General information

Valuation

Company description
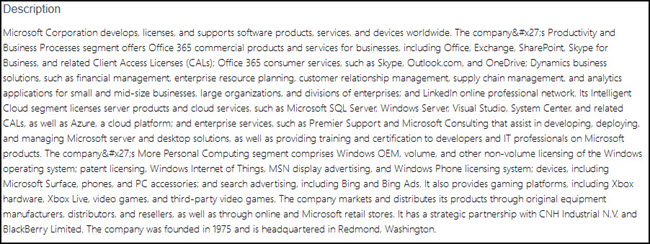
Click image to enlarge
Quality

Momentum

Growth

Share price
Click image to enlarge
Ranking
The ranking charts show you the position of the company you clicked on compared to all the companies in the screen you ran.
Use the drop down menus (click the down arrow) to change the ratios shown in the charts.
Click to enlarge
Screener results grouped
Another feature is you can easily group your results by any of the ratios or indicators in the columns you have selected.
This is helpful to see if there are any industry or country concentrations in the screen you ran.
It of course is only helpful to group the results if the same value appears a few times for example; country, industry, and F-Score.
To group the results simply drag the column heading into the field shown below.
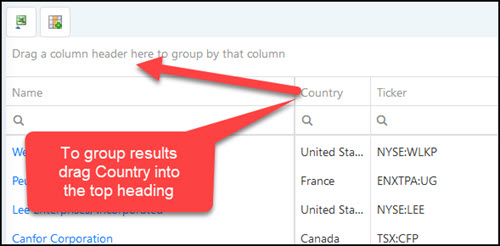
Grouped results look like this:

Filters and the Template can be selected and saved separately
A Filter is a screen you have put together or loaded from the screens you have saved.
A Template is the columns (ratios and indicators) you have selected that you would like to display when you run a screen.
The last major improvement is that the screens you save and how the results of the screen are displayed (the columns shown) can be selected separately.
This feature allows you to – with the same screen – quickly change the columns shown from valuation ratios to momentum. This saves you from having to scroll to the right all the time.
The filter and template you are using are always shown at the top of the page.

Change a template
To change a template do the following:
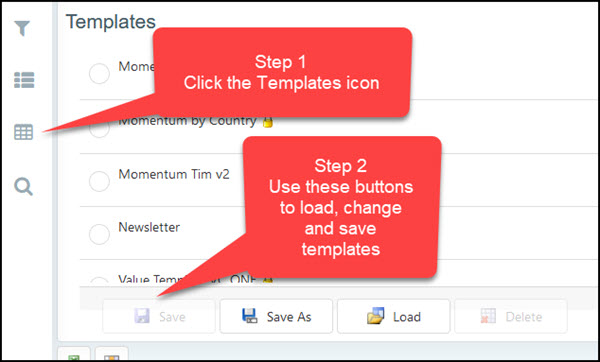
Change a Filter
To change a filter do the following:
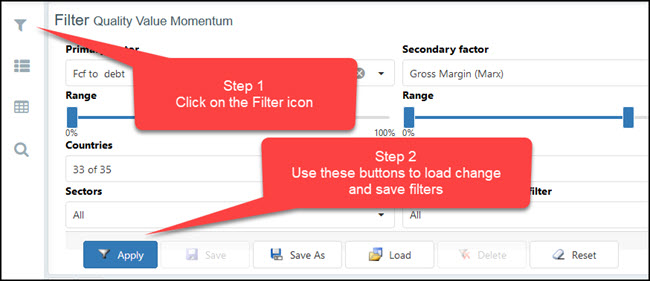
These are all the major changes in the new screener.
We hope you find it valuable.
PS If you are not a subscriber yet you can sign up right here: Join Today
PPS It's so easy to get distracted, why not sign up right now!


