
If you use Joel Greenblatt’s Magic Formula, should you focus on a company’s last 12 months or its long-term results?
This article compares both approaches using a 38-year backtest. You’ll see how short-term (1-year) and long-term (8-year) results impact investment returns—and discover a surprising result. Understanding this can save you time and help you make better investment decisions.
Estimated Reading Time: 6 minutes
The Battle of Timeframes: Long-Term vs. Short-Term Magic Formula Strategies
When it comes to investing, timing frames can make a difference. If you’re using Joel Greenblatt’s Magic Formula, you might wonder: should you focus on a company’s recent 12-month performance or look at its long-term history when calculating the Magic Formula ratios?
This article shows you two approaches—using short-term (12-month) data and long-term (8-year average) data — when applying the Magic Formula.
Understanding Long-Term vs. Short-Term Magic Formula Strategies
What Is the Short-Term Magic Formula Strategy?
The short-term Magic Formula uses the most recent (trailing) 12 months of financial data to rank companies based on Return on Invested Capital (ROIC) and Earnings Yield. This approach focuses on a company’s latest performance, which many investors believe gives the best snapshot of its current health.
What Is the Long-Term Magic Formula Strategy?
The long-term Magic Formula, on the other hand, averages a company’s ROIC and Earnings Yield over the past 8 years. This smooths out the short-term ups and downs, giving a clearer view of how the company performs over time.
The ratios are calculated as follows:
- Valuation = 8-year average earnings before interest and taxes (EBIT)) to current total enterprise value (TEV)
- Quality = 8-year average EBIT to current net property plant and equipment (NPPE) plus net working capital
By comparing these two strategies, you can see that the short-term version focuses on recent trends, while the long-term approach looks at the bigger picture over several years.
Click here to start finding your own Magic Formula ideas NOW!
The 38-Year Backtest: Long-Term vs. Short-Term Performance
A 38-year backtest was conducted to compare the performance of both the long-term and short-term Magic Formula strategies. This study looked at thousands of companies from 1972 to 2010 and included different market conditions, like booms and crashes.
This was the compound annual returns over the 38 year period from 1972 to 2010:
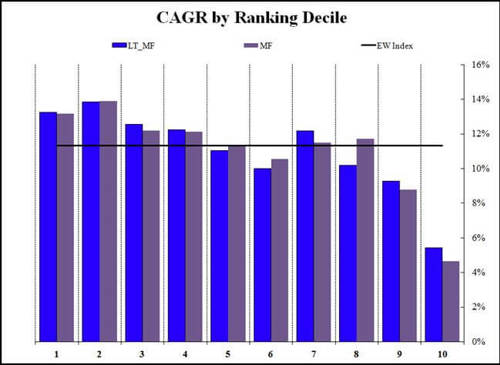
Source: Magic Formula: Long-Term 8-year vs. Short-Term
1 = Best ranked Magic Formula companies
10 = Worse rated Magic Formula companies
Blue bars = 8-year average Magic Formula performance
Grey bars = Trailing 12 months Magic Formula performance
What they found – long term does not add value!
As you can see the results were largely the same (blue bars same as grey). Using the long-term Magic formula would not have added much to your returns.
This was unusual!
What was interesting is that the second 10% of Magic Formula companies (second decile, no 2 in the chart) performed better than the best ranked companies for both the long term and 12-month Magic Formula.
Click here to start finding your own Magic Formula ideas NOW!
FREQUENTLY ASKED QUESTIONS
1. Should I use the short-term or long-term Magic Formula strategy?
The backtest shows that both strategies give similar results. That means using an 8-year average doesn’t improve your returns compared to using just the last 12 months. So, the short-term strategy is good enough—it keeps things simple and still works well.
2. If long-term doesn’t add value, why do investors use it?
Some investors like long-term data because it smooths out short-term changes. It helps them avoid companies that just had a lucky year. But the backtest shows this extra step doesn’t improve returns. So, it’s not necessary unless you personally feel more comfortable with a long-term view.
3. Why did the second-best group of stocks perform better than the top-ranked ones?
That’s a surprising result! One reason could be that the best-ranked companies are sometimes too cheap—they might have serious problems. The second-best group may include more solid companies that are still undervalued but have fewer risks. To implement this make sure you select the top 20% of Magic Formula companies
4. How do I apply the Magic Formula in real investing?
You pick stocks with high Earnings Yield and high Return on Invested Capital (ROIC) using the latest 12-month data. Then, rank them using both ratios into a combined ranking and buy a portfolio of the best ranked companies. Hold them for a year, then repeat. It’s a simple, rule-based system to find good stocks.
5. Does the Magic Formula work in all market conditions?
The 38-year backtest included booms and crashes, and the strategy still worked. That means the formula has stood the test of time. However, like all strategies, there will be down and underperforming years. The key is to stick with it and stay disciplined.
6. Can I tweak the Magic Formula to make it better?
Yes! Some investors adjust the formula to avoid certain industries or add their own filters. For example, you could remove companies with too much debt or only pick stocks from industries you understand. Just be careful—too many changes could hurt your returns.
7. What’s the biggest mistake investors make with the Magic Formula?
Not following it consistently. Many investors quit after a bad year or try to out think the formula. But the strategy works over time because it follows a proven system. Stick to the process, and you’ll give yourself the best chance of success.
Click here to start finding your own Magic Formula ideas NOW!